DOGE by the Numbers: What Government Efficiency Looks Like in Practice

Although the Department of Government Efficiency (DOGE) is widely recognized, few people actively track the detailed data it publishes in real time at doge.gov. DOGE maintains an expanding set of dashboards offering real-time visibility into federal savings, payments, spending, regulations, and workforce size.
This article provides a high-level snapshot of DOGE’s most recent public data as of March 23, 2025:
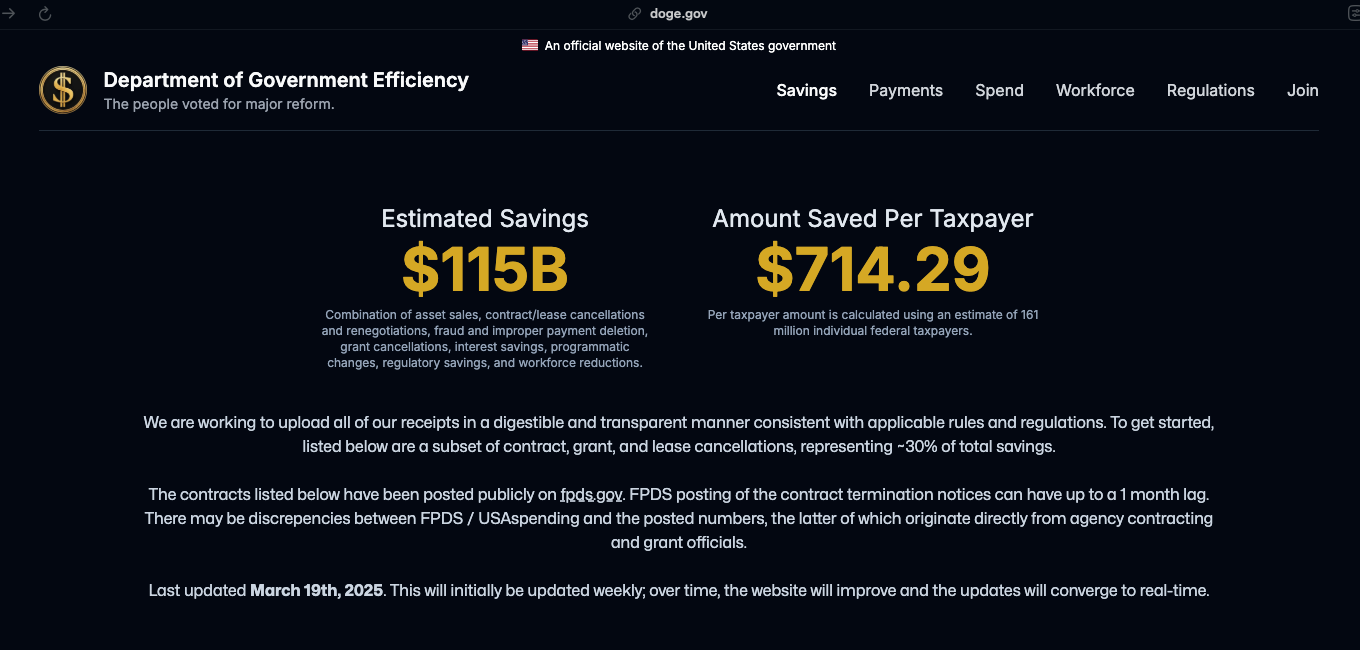
- $115 billion in estimated federal savings from canceled contracts, grants, leases, and fraud prevention
- $714.29 saved per taxpayer, based on 161 million individual taxpayers
- $215 billion in annual grant payments, now updated daily in beta for greater transparency
- 51.7% increase in federal spending since FY2019; the deficit rose by 85.9%
- 98.7 million words of regulation, with a regulatory-to-legislation ratio of 18.5:1
- 2.25 million federal employees, with an average salary of $93,828 and average tenure of 10 years
All figures are sourced directly from DOGE’s official site. This summary highlights select insights and does not represent the full breadth of available data.
Savings: $115 Billion Identified
DOGE reports an estimated $115 billion in federal savings from a range of efforts, including:
- Asset sales
- Contract, lease, and grant cancellations
- Renegotiations
- Fraud and improper payment removal
- Interest and programmatic savings
- Regulatory streamlining
- Workforce reductions
This translates to approximately $714 per taxpayer, based on 161 million estimated taxpayers.
So far, DOGE has published:
- 5,634 contract terminations (~$20B saved)
- 7,616 grant terminations (~$18B saved)
- 657 lease terminations (covering 7.9M sq ft, ~$350M saved)
DOGE notes that only ~30% of total savings have been itemized online to date. These figures are updated regularly, with the last published update on March 19, 2025.
Payments: A Move Toward Daily Disclosure
DOGE has launched a beta program for publishing daily federal payment records, starting with grant disbursements totaling approximately $215 billion annually.
Each transaction includes:
- Agency name
- Recipient organization
- Award description
- Payment amount
- Payment date
DOGE’s goal is to show how taxpayer funds are actually being distributed. Previously, many federal payments lacked proper documentation. Under a new requirement, a brief written justification will soon be submitted by the agency employee who approved each payment and posted publicly alongside the transaction.
DOGE emphasizes that it does not approve or disapprove any payments; it simply makes them visible. The most recent update to the payments dashboard was posted on March 9, 2025.
Federal Spending Trends: +51.7% Since 2019
DOGE's fiscal dashboard shows changes in government spending from FY2019 to FY2024:
| Metric | FY2019 | FY2024 | % Change |
|---|---|---|---|
| Total Spending | $4.45T | $6.75T | +51.7% |
| Total Revenue | $3.46T | $4.92T | +42.0% |
| Federal Deficit | $984.4B | $1.83T | +85.9% |
Top spenders in FY2024 include:
- HHS: $1.72T
- SSA: $1.52T
- Treasury: $1.31T
- DOD: $826.3B
The General Services Administration (GSA) reported negative net spending (-$0.2B), likely reflecting offsets from cost-saving programs.
Workforce: Mapping the Human Side of Government
As of March 2024, DOGE's workforce data—sourced from the U.S. Office of Personnel Management—provides the following snapshot of the executive branch (excluding military, postal, intelligence, and other categories):
- 2,252,162 employees
- $211.3B in total wages
- $93,828 average salary
- 10 years average tenure
- 47 years average age
- 16,436 subordinate offices across the government
DOGE has also cataloged 34 Cabinet-level agencies, 43 large independents, 63 medium, and 119 small agencies.
Regulatory Scope: 98.68 Million Words
DOGE tracks the size and scope of federal regulation using the Code of Federal Regulations (CFR). As of 2024:
- 98.68 million words
- 215,230 regulatory sections
DOGE has introduced an “Unconstitutionality Index”, which tracks the number of agency rules issued per law passed by Congress. In 2024, this ratio was 18.5:1.
Top regulatory agencies by word count:
- Department of the Treasury – 14.5M words
- EPA – 12.2M words
- HHS – 7.2M words
- Department of Agriculture – 7.0M words
This metric doesn’t evaluate regulatory quality, but it does offer a quantitative measure of administrative scope.
A Work in Progress, But a Clear Direction
DOGE notes that many of its dashboards are in early stages. Some data is still being uploaded; others may lag behind established sources like FPDS or USAspending due to reporting delays. In places, DOGE explicitly acknowledges the potential for errors as it builds new infrastructure.
Still, the direction is clear. DOGE is shifting federal accountability from static reports to live, searchable public dashboards. While the datasets speak for themselves, they also invite new questions—about efficiency, scale, and transparency—that were harder to ask before.
For an agency focused on government efficiency, that may be the most measurable outcome of all.
🔔 Subscribe to get the latest insights!
📧 For inquiries, email patrick.han@cliwant.com