How DOGE Is Shaping Federal Contracting – In Partnership with Northwestern Kellogg

In collaboration with researchers from Northwestern University's Kellogg School of Management, CLIWANT analyzed federal procurement data from SAM.gov to uncover patterns before and after the 2024 election.
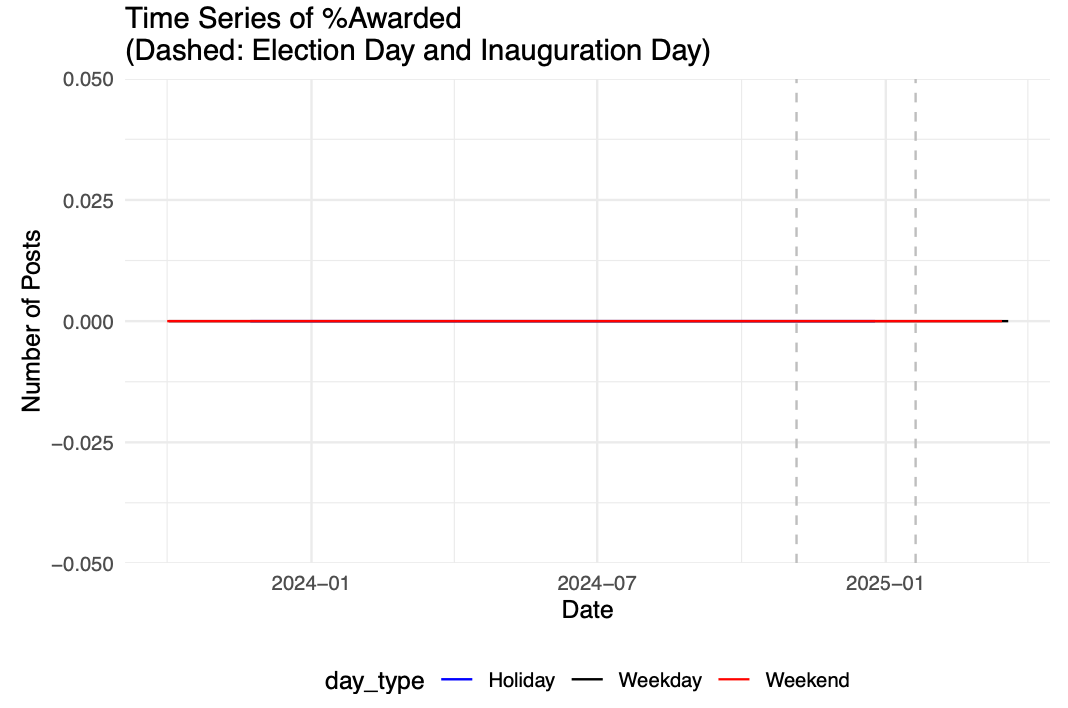
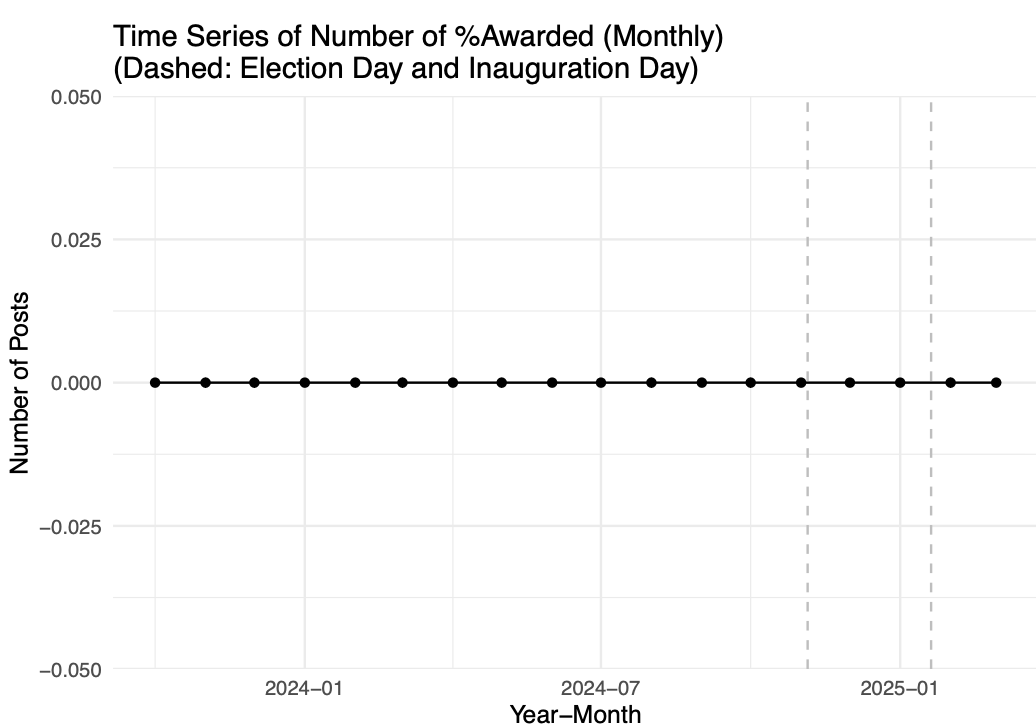
While federal project postings have largely recovered after the inauguration, awards have not — suggesting a deeper pause in procurement activity.
Key insights include:
- Around 1,000 new solicitations are posted daily.
- Awarded contracts virtually stopped after the 2024 election, despite steady postings.
- The median award remains modest (~$8,800), but several contracts exceed $10 million — and even $1 billion.
- Only 20% of awarded vendors won more than once, showing intense competition and low repeatability.
- The Department of Defense dominates procurement, especially through the Defense Logistics Agency and U.S. Air Force.
- Hardware, IT, and medical contracts lead in volume and value, depending on how you measure.
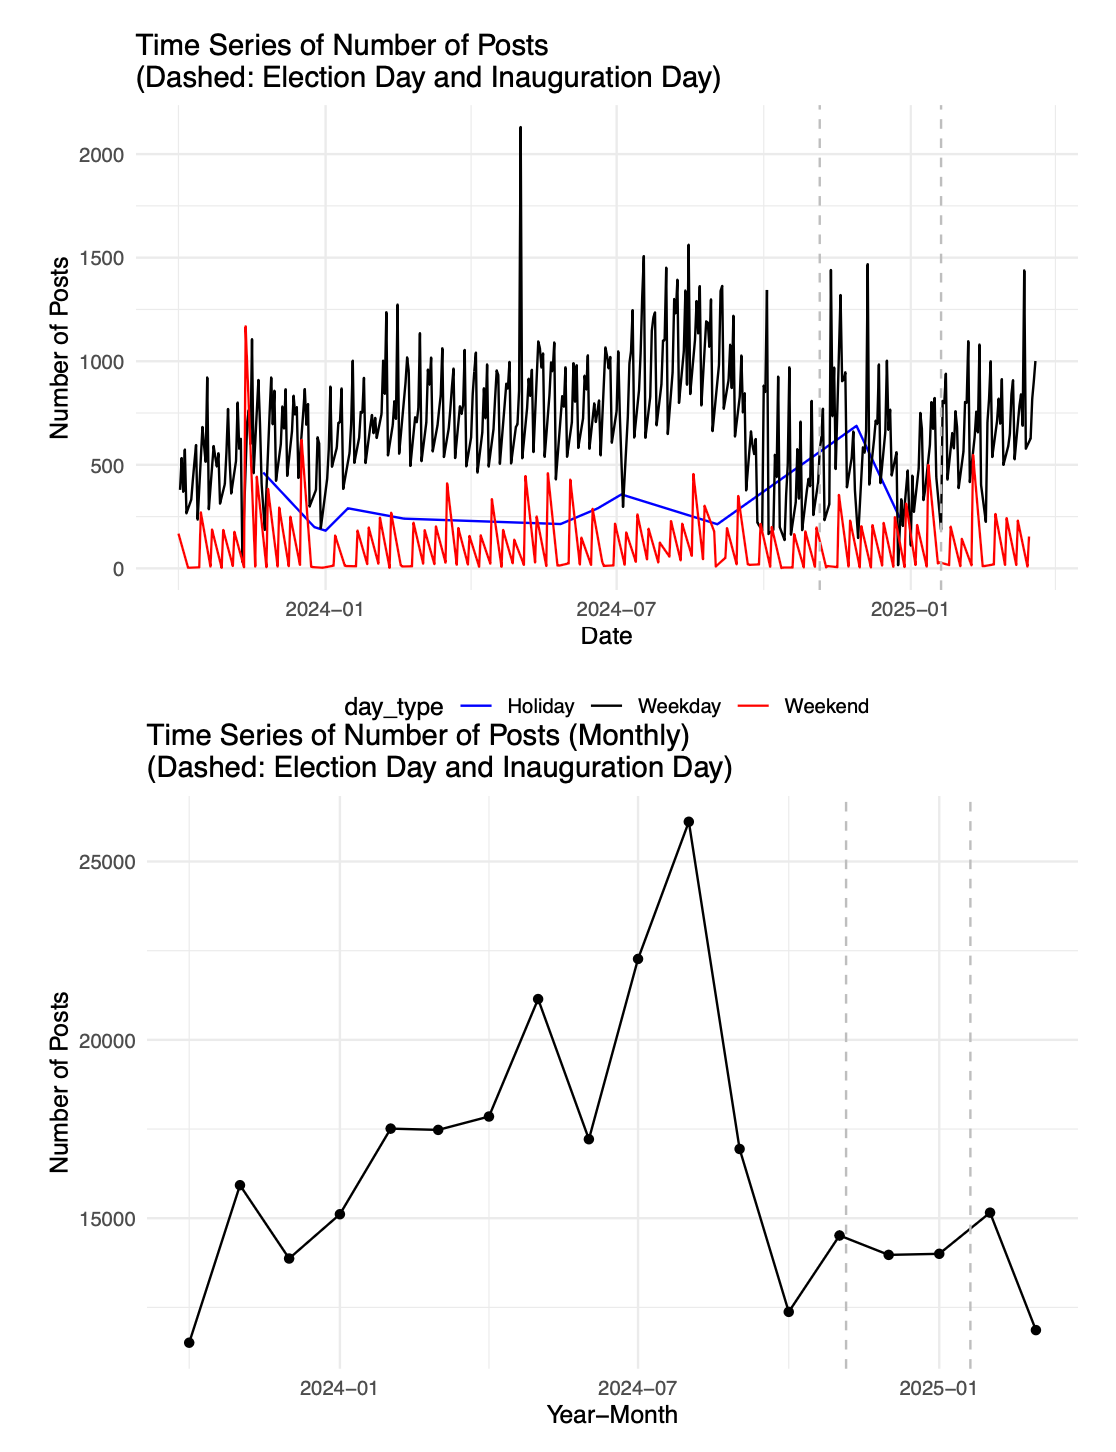
Post-Election Freeze: Awards Halted, Postings Recovered
Federal solicitation activity dipped significantly in the months leading up to the 2024 election. However, after the inauguration, project postings began to recover to pre-election levels.
The real story? Federal contract awards have nearly halted since the election, diverging from historical patterns where ~20% of solicitations led to awards.
Graph: Time Series of Number of Posts (Daily & Monthly)
Graph: Time Series of % Awarded Projects (Daily & Monthly)
A Market of Extremes
Award sizes are deeply uneven. While the median contract is modest (~$8,800), the top 5% of awards exceed $10 million, with the largest crossing $70 billion.
Graph: Distribution of Federal Award Values
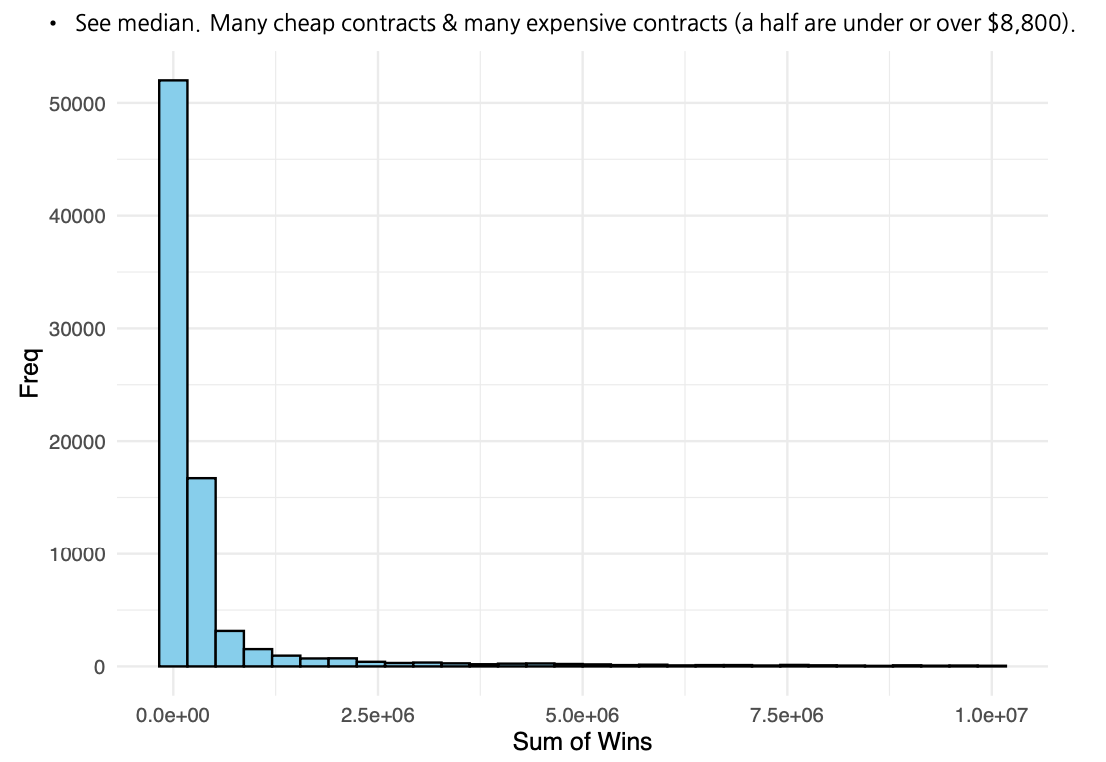
Large contracts tend to go to highly specialized firms in areas like aerospace, defense, and IT — sectors that continue to demand transparency and accountability.
Most Firms Win Only Once
Between October 1, 2023, and March 20, 2025, 4,556 firms won at least one federal contract, but 80% of them only won once.
This indicates a fragmented and hyper-competitive federal market, where long-term traction is rare.
Graph: Distribution of Contract Wins per Firm
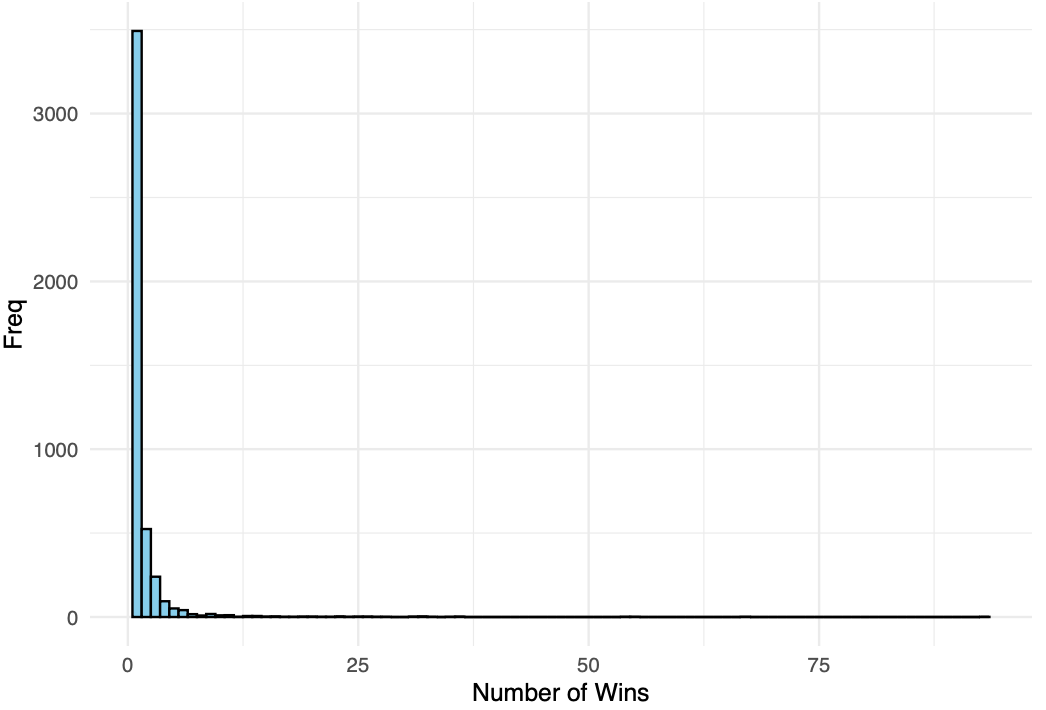
Repeat success now depends on sustained performance and aligning closely with agency needs.
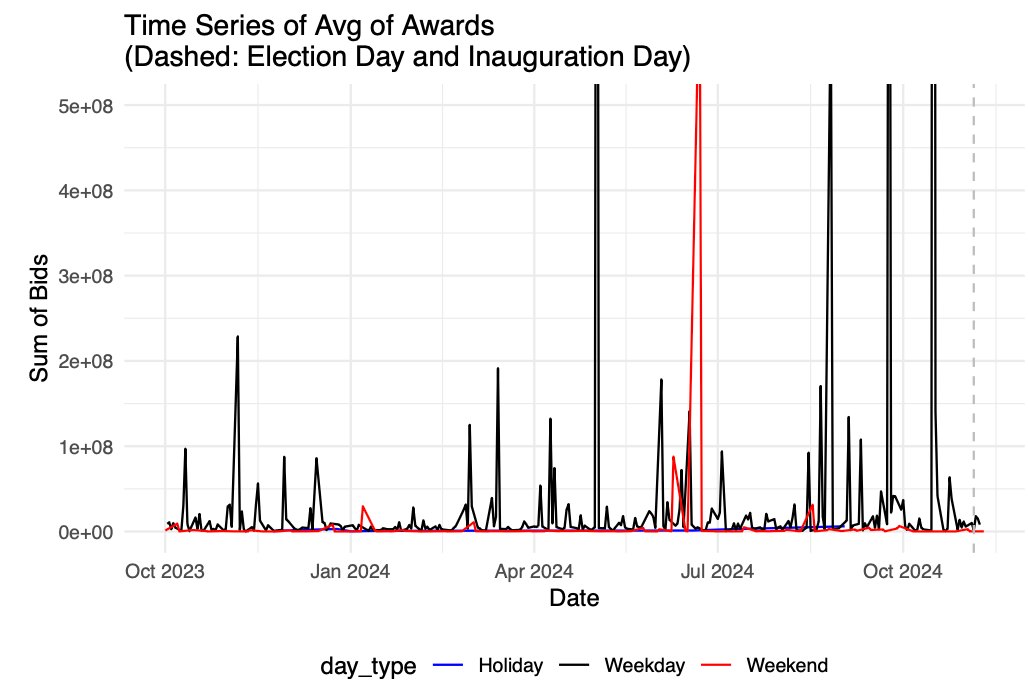
Award Activity Still on Pause
The most striking insight: award activity has not bounced back post-election.
Even as project postings recovered, awarded contracts — both in count and total value — remain at historical lows.
Graph: Summary of Awards by Date (Daily Count & Total Value)
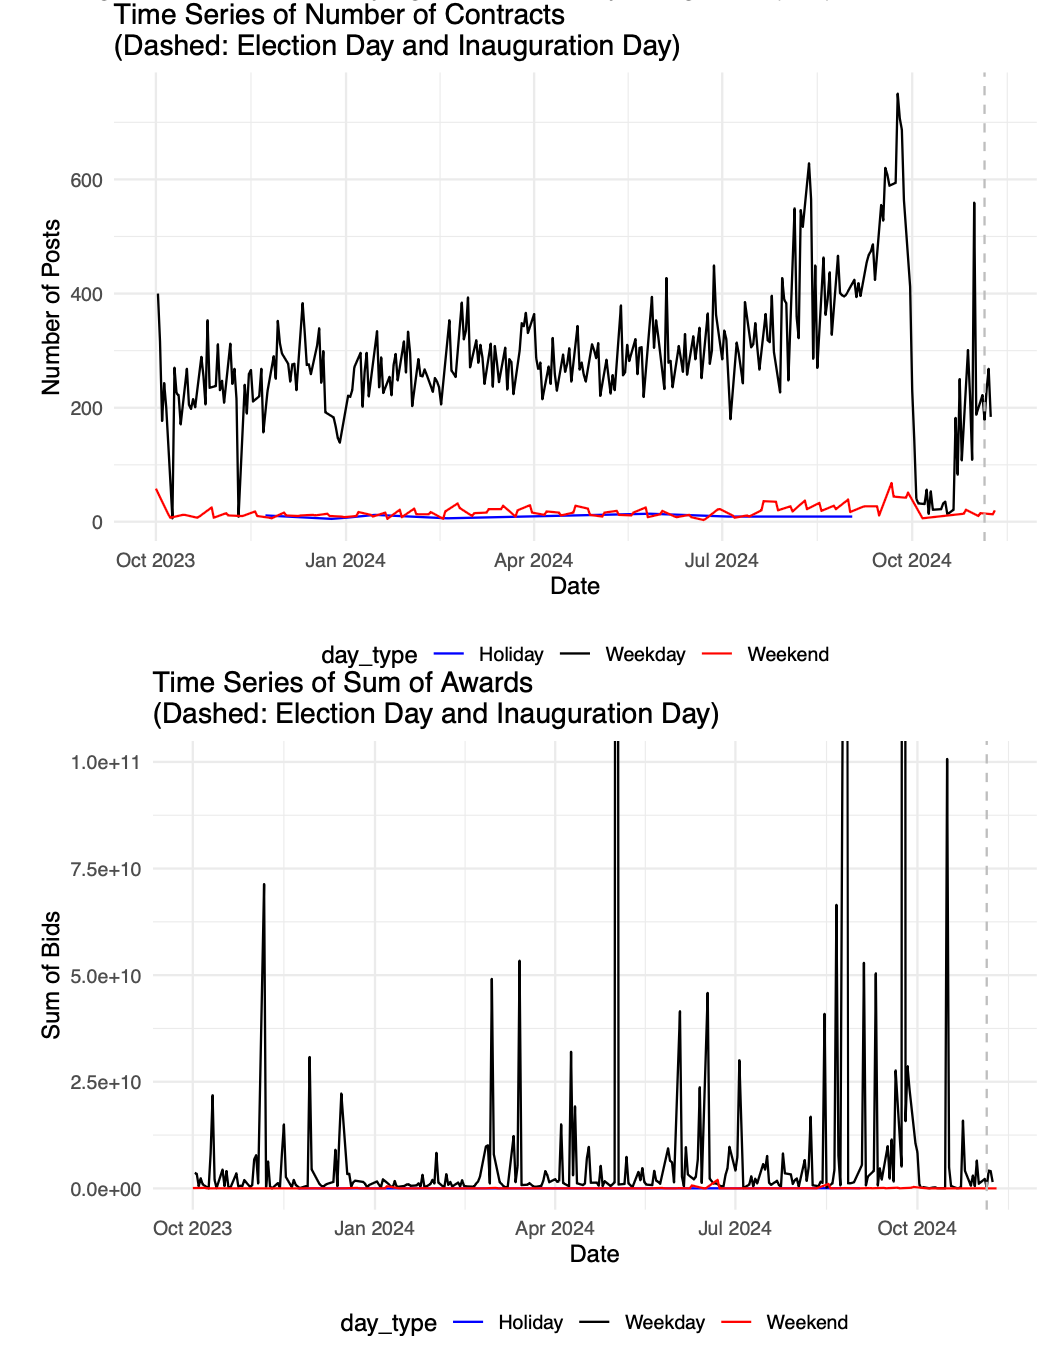
Before the freeze:
- Median daily award value: ~$3.2 million
- Most awards flowed through defense and infrastructure agencies
This freeze suggests a policy-driven pause or internal reassessment at the federal level.
Defense Still Dominates
The Department of Defense continues to lead in both project postings and contract awards, particularly through the Defense Logistics Agency (DLA) and the Air Force.
Graph: Projects by Department (DEPT)
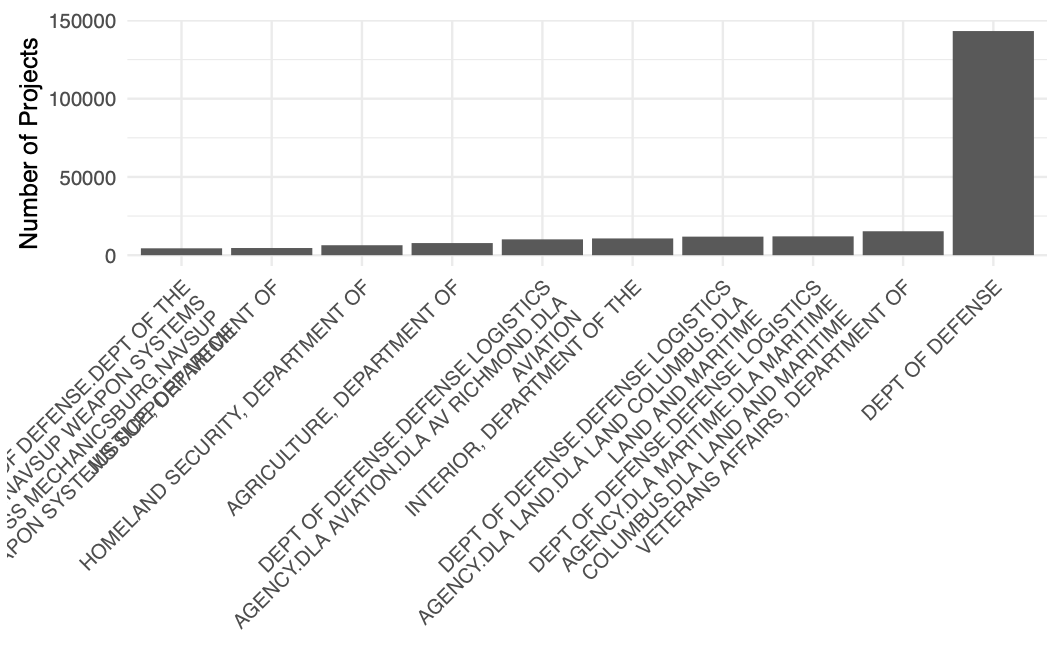
Other active civilian agencies include Veterans Affairs, Interior, and Homeland Security — though their activity remains much smaller in scale.
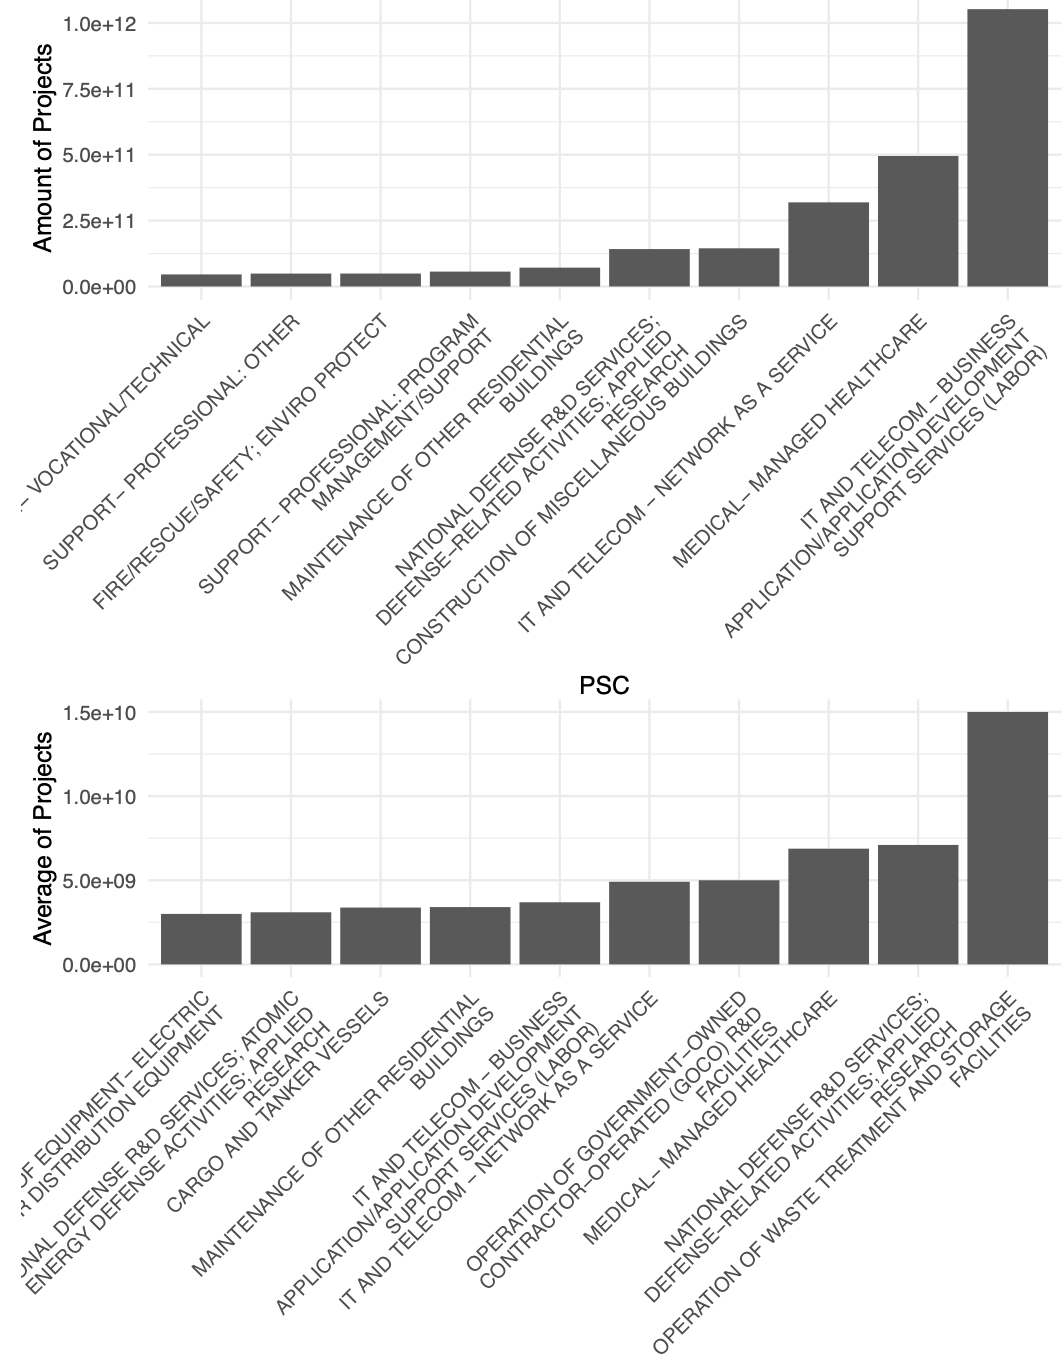
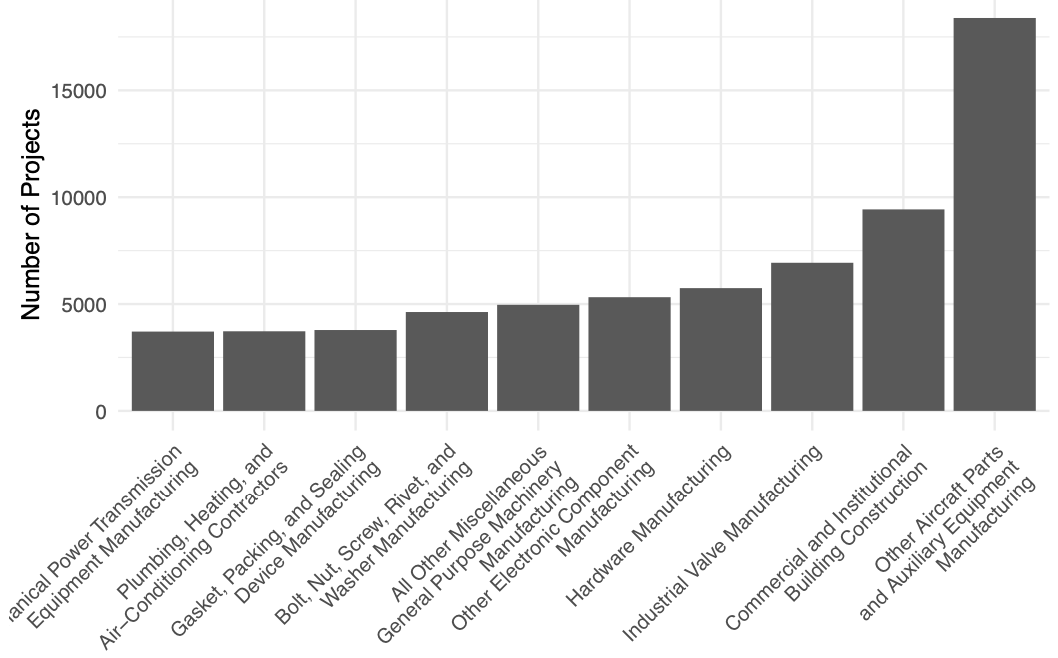
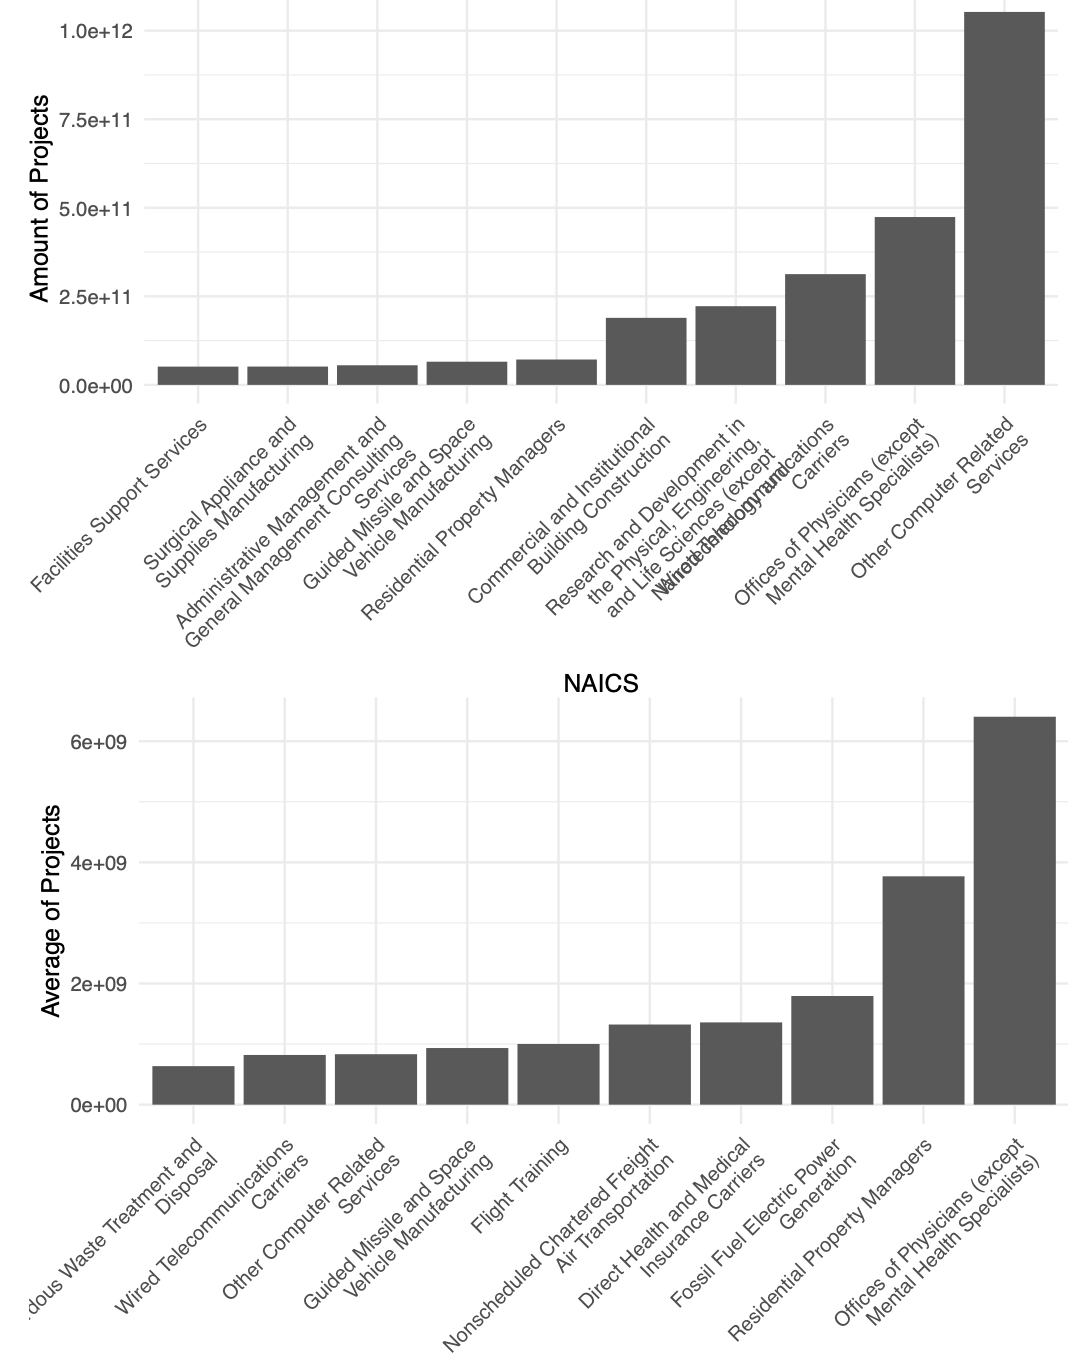
Product & Sector Insights: PSC and NAICS Data
At a more granular level, we analyzed data by Product and Service Code (PSC) and NAICS classification:
- High-volume sectors: Hardware, logistics, construction
- High-spending sectors: IT services, healthcare, R&D
Graph: Projects by PSC (Volume, Total & Avg Value)
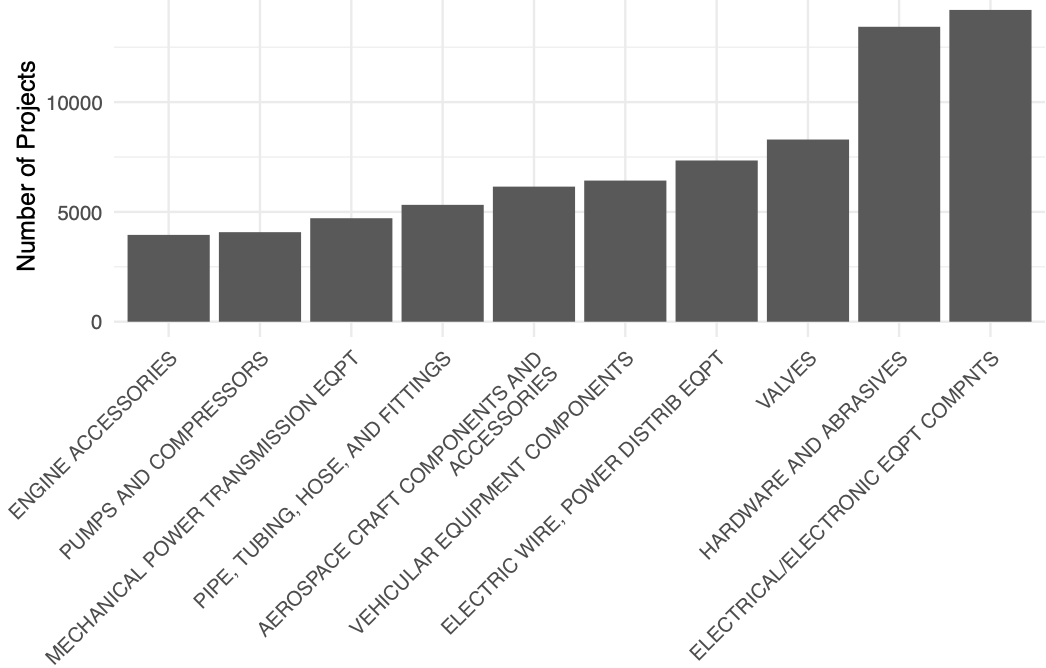
Graph: Projects by NAICS (Volume, Total & Avg Value)
This signals two viable approaches for contractors:
- Volume-based strategy: Pursue repeatable, lower-value opportunities in hardware/logistics.
- Value-based strategy: Target fewer but higher-value bids in IT, health, and research.
What This Means for Federal Contractors
The 2024–2025 post-election freeze underscores a structural shift in procurement priorities:
- More transparency, less automatic awarding
- Higher bar for documentation, accountability, and proven outcomes
- Greater pressure on ambiguous or under-defined projects
CLIWANT’s joint investigation with Nicolas Min (Kellogg School of Management) aims to provide contractors with clear, data-driven guidance — not just for compliance, but for staying competitive.
Sources: Analysis of SAM.gov contract data by CLIWANT and Nicolas Min (Kellogg School of Management, Northwestern University).
🔔 Subscribe for more insights on government contracting
📧 Contact: patrick.han@cliwant.com