CLIWANT Helps You Win More! — Northwestern Study Proves It
How much revenue growth can CLIWANT drive?
We’ve struggled to answer this question clearly—for one simple reason: we didn’t actually know.
Measuring CLIWANT’s true impact is hard. Results vary widely, and gathering the right data takes time, discipline, and patience.
So we turned to someone who could help us get it right. We partnered with Dr. Nicolas Min at Northwestern University’s Kellogg School of Management to run a rigorous statistical analysis.
What you’ll see below is exactly what we got—no edits, no spin. The analysis speaks for itself. If there were a way to tweak the numbers, believe us—we would’ve made them look even better.
The Impact of CLIWANT — At a Glance
📈 Increased Revenue
In their very first month, companies using CLIWANT won an average of $150,000 more in contract value compared to non-users. (*See methodology below for how non-users were selected.)
💰 Maximized ROI
CLIWANT users consistently reported ROI far exceeding the cost of the service. The longer they used it, the greater the returns—proof that strategic adoption compounds over time.
⏳ Time & Cost Savings
Survey data shows CLIWANT cut procurement-related workload by 62% on average.
- For a bidding manager earning $50,000/year, that’s a savings of roughly $31,000 per person annually.
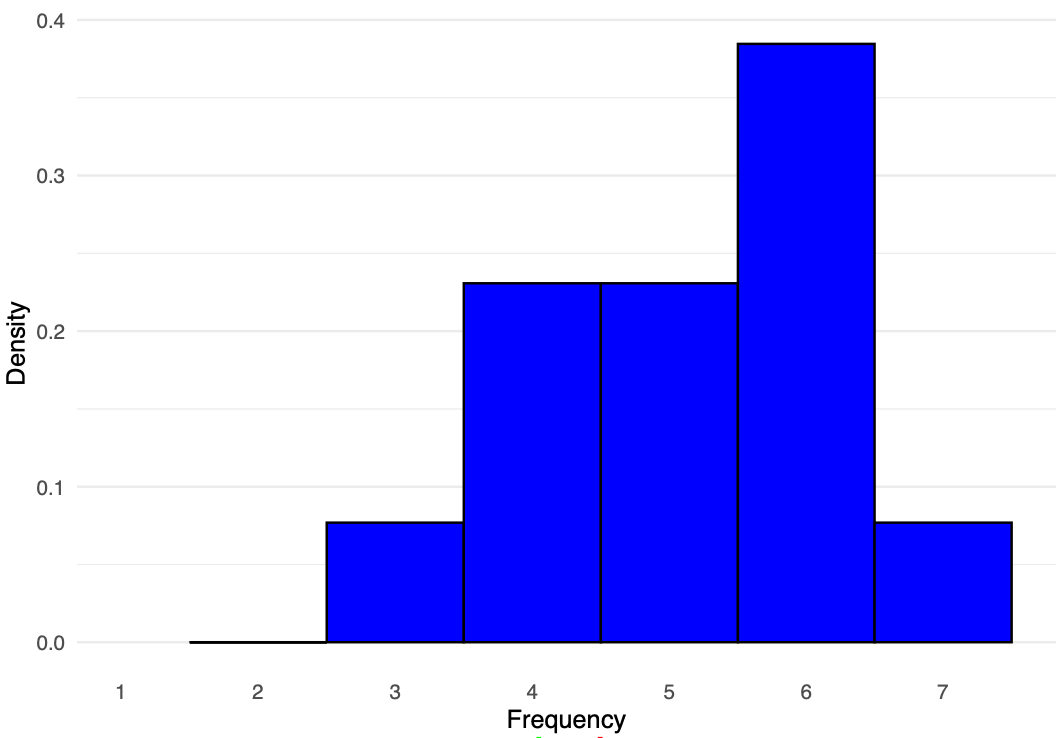
- And with most companies having 5–7 users, the impact adds up fast.
The results surfaced areas we still need to improve—but also gave us some genuinely encouraging signals.
As we head into 2025, we're not just celebrating our wins—we're being honest about what needs improvement and doubling down on delivering even more value. We're incredibly thankful to all the clients who put their trust in CLIWANT during our first year.
Methodology Overview
As of December 2024, CLIWANT serves approximately 70 paying clients. This analysis focuses on 59 companies actively engaged in public procurement, excluding associations and strategic partners not directly involved in bidding.
1. Procurement Performance of CLIWANT Clients
We analyzed key procurement metrics, including:
- Company Profile: CLIWANT adoption date, KONEPS registration date, first bid submission date, number of employees
- Bidding Performance: Number of bids submitted, wins, and contracts awarded
- Performance Indicators:
- Win rate
- Average response time (from bid posting to submission)
- ROI (return on investment): increase in awarded contract value relative to service cost
2. CLIWANT Client Survey
To assess the qualitative impact of the service, we conducted a client survey measuring:
- Time spent using CLIWANT and proportion of B2G revenue
- Reduction in procurement workload and stress
- Time savings by feature (e.g., bid discovery, RFP review, competitor analysis)
- Correlation analysis between survey responses to identify patterns and insights
3. Performance Comparison: CLIWANT Clients vs. Non-Clients
To objectively assess CLIWANT’s impact, we compared the outcomes of client companies with a matched group of non-clients.
- Non-Client Selection: Companies matched by industry, company size, and bidding activity
- Metrics Compared: Number of bids submitted, win rate, wins, and contracts awarded
This multi-layered analysis was designed to offer a data-driven, objective view of how CLIWANT contributes to improved outcomes in public procurement.
1. Procurement Statistics of CLIWANT Clients
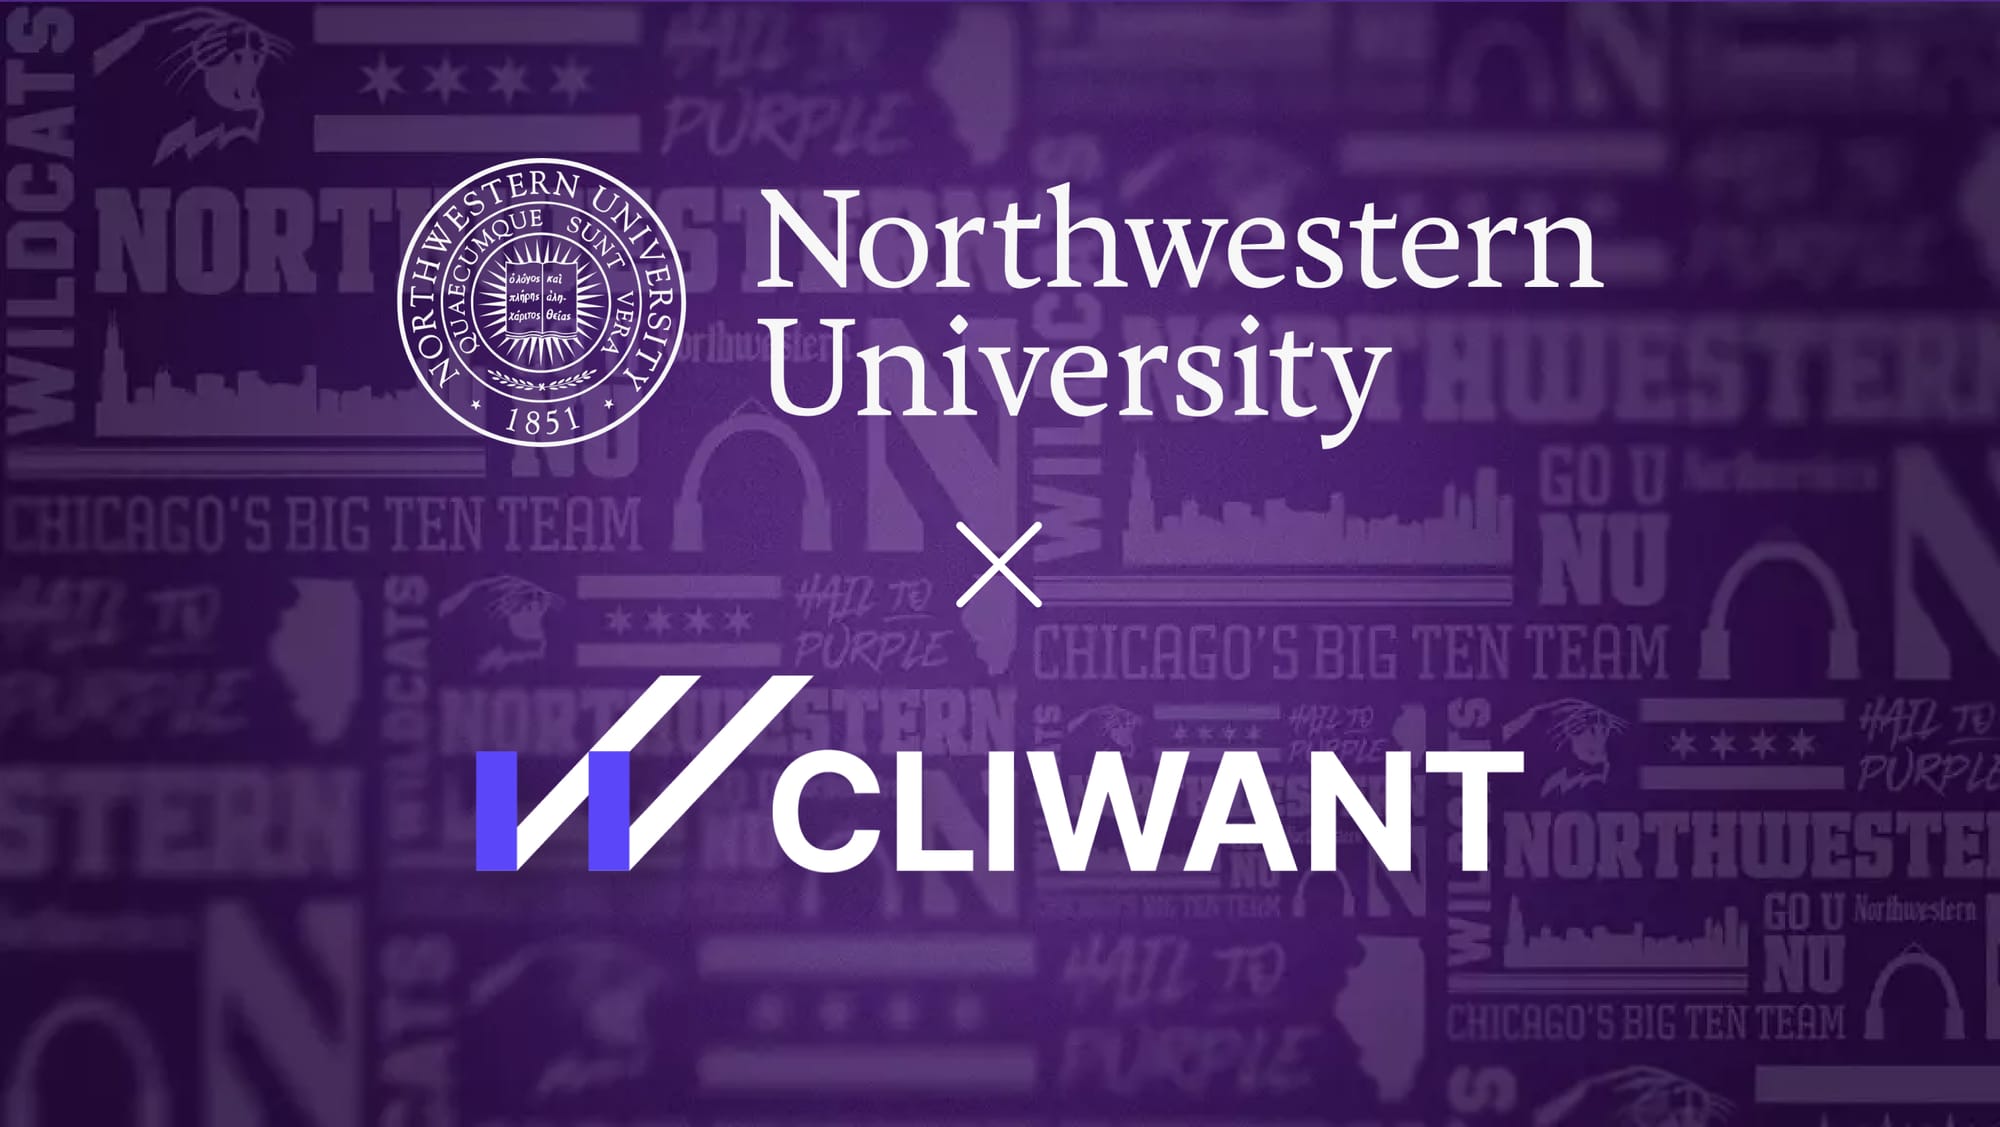
CLIWANT officially launched in January 2024 and has seen steady growth since, with 5–6 new companies joining the platform each month.
Interestingly, it's not just experienced bidders adopting the platform—newer companies, particularly those entering the public sector for the first time since 2018, are joining even more actively in search of growth opportunities.
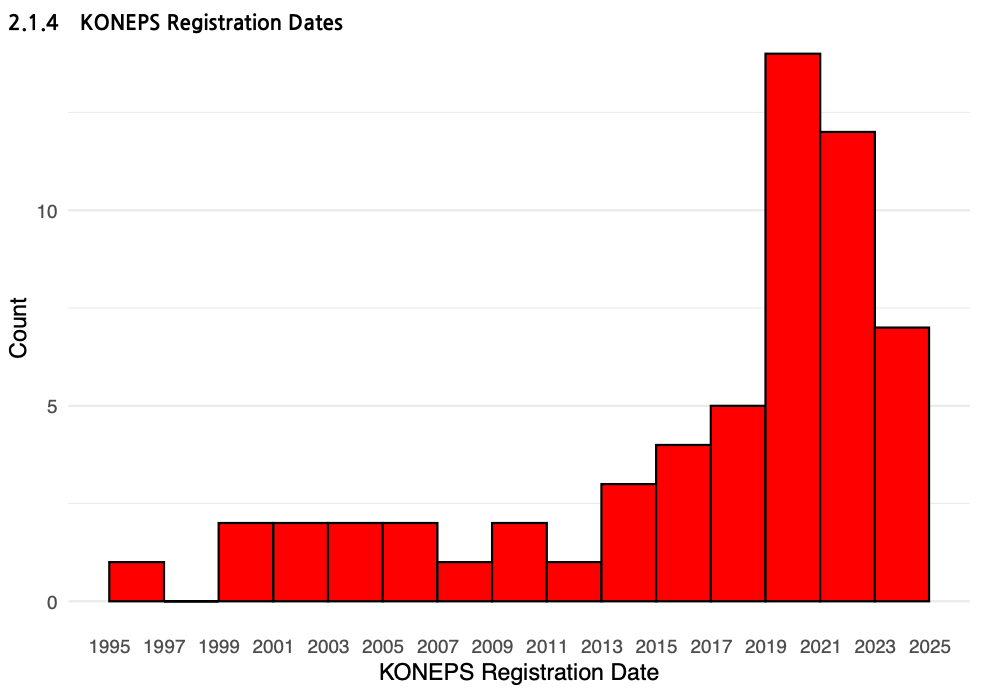
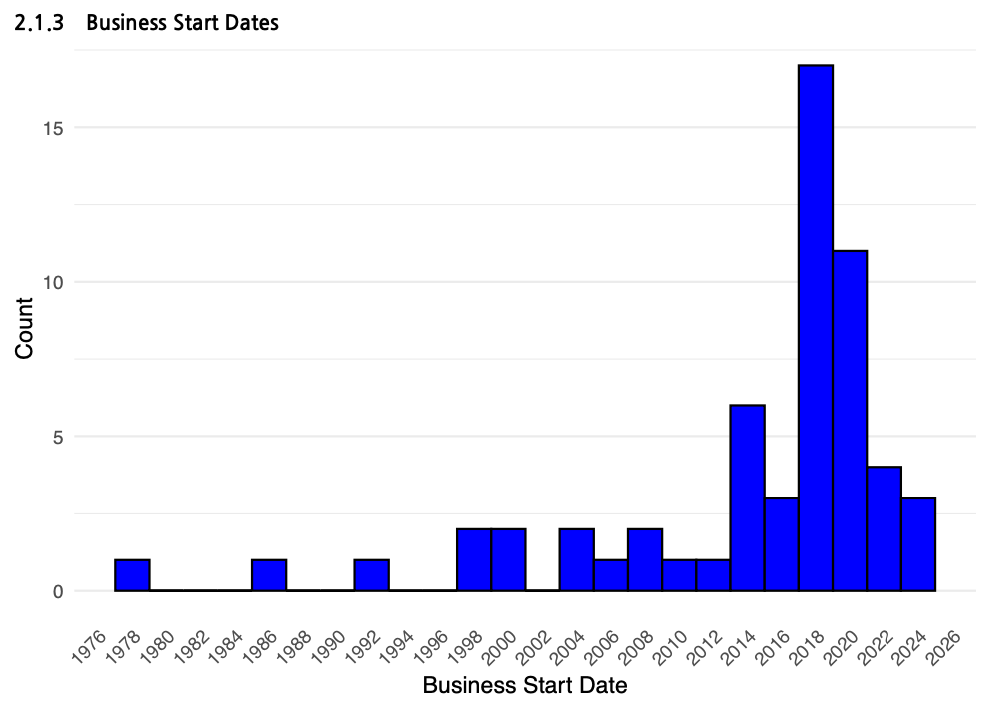
KONEPS registration dates and initial bid submission dates of CLIWANT clients
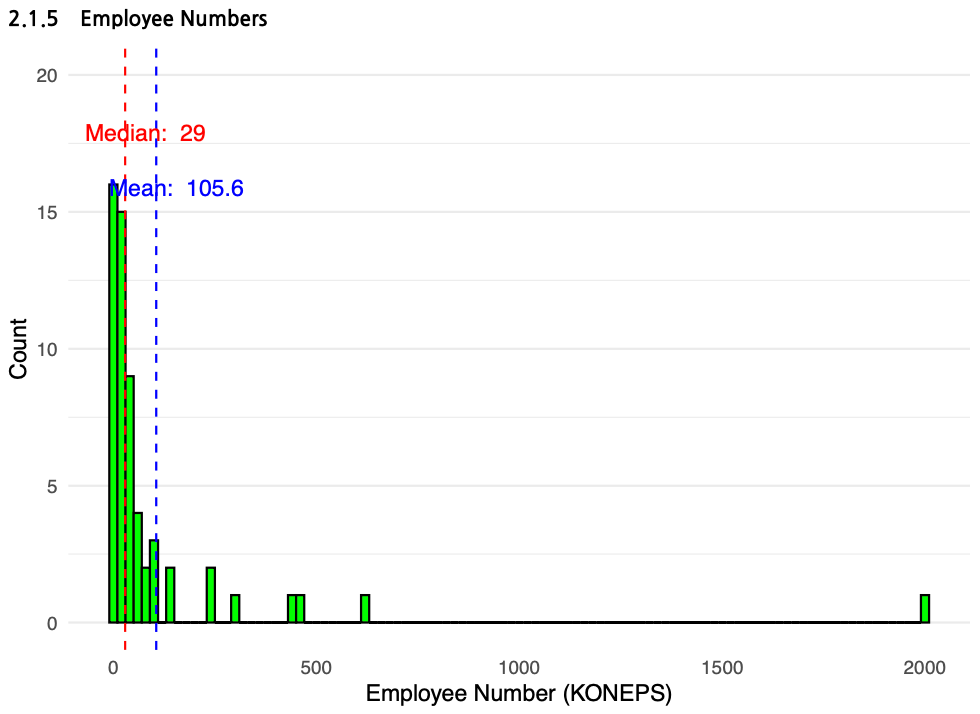
The median number of employees among CLIWANT client companies is 29, with the majority classified as startups or small to mid-sized enterprises (SMEs).
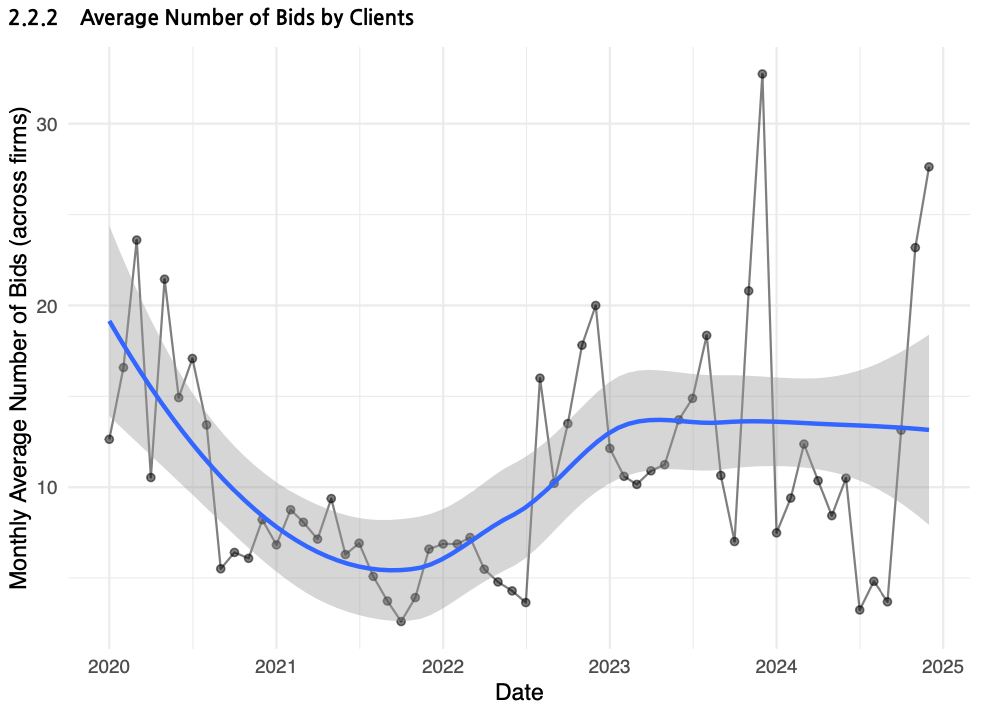
Most CLIWANT clients gradually reduced their bidding activity between 2020 and 2021, but began increasing it again in 2022. These companies are not simply maintaining their presence in the public sector—they are actively looking to expand it.
This shift appears to be driven by rising inflation and a weakening private sector following the end of COVID-19 in 2022, which led many companies to turn to public projects as a more stable and reliable source of revenue.
Although the number of successful bids and contracts by CLIWANT client companies has declined year over year, the total awarded contract value—approximately $385,000—has remained stable since 2020.
Notably, CLIWANT clients secured average contract values over $150,000 higher than those of non-client companies. (A detailed comparison with non-clients is provided below.)
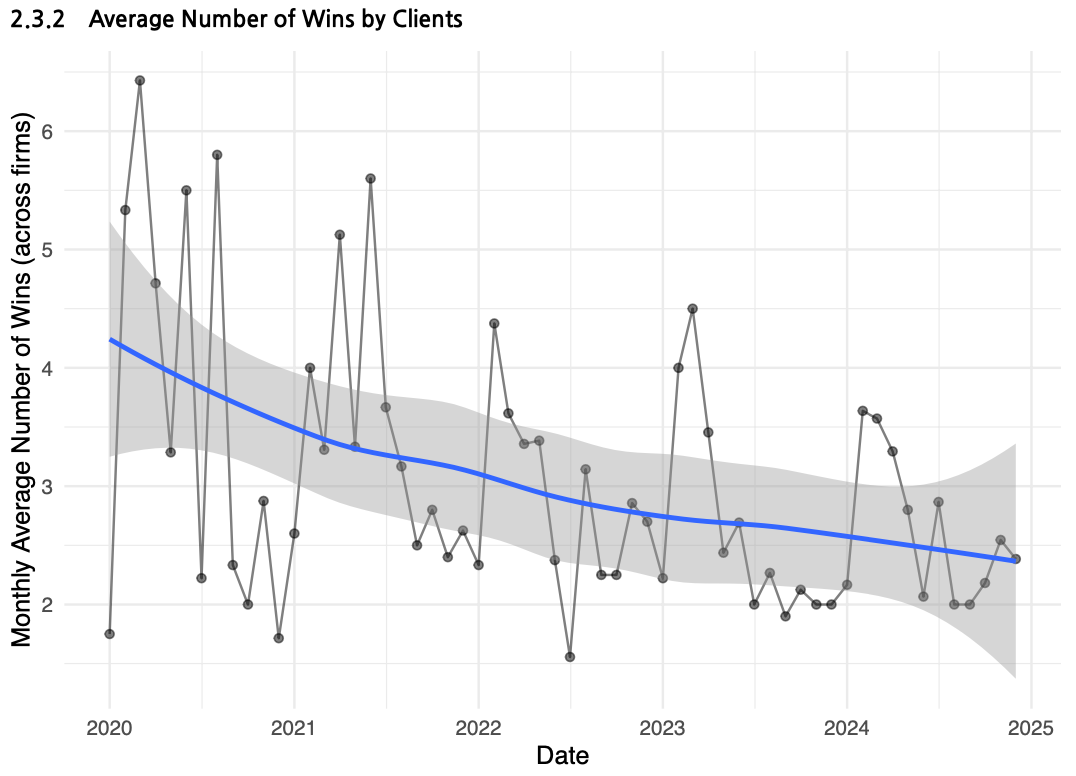
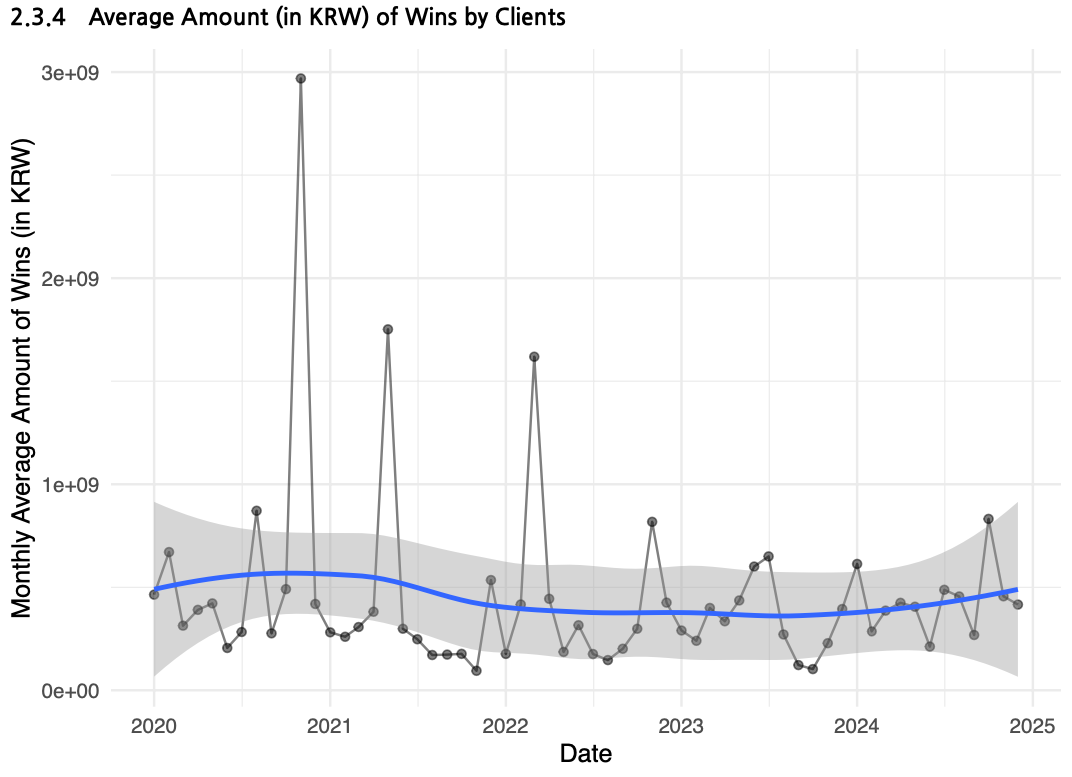
Average Number of Wins and Average Award Amount for CLIWANT Client Companies
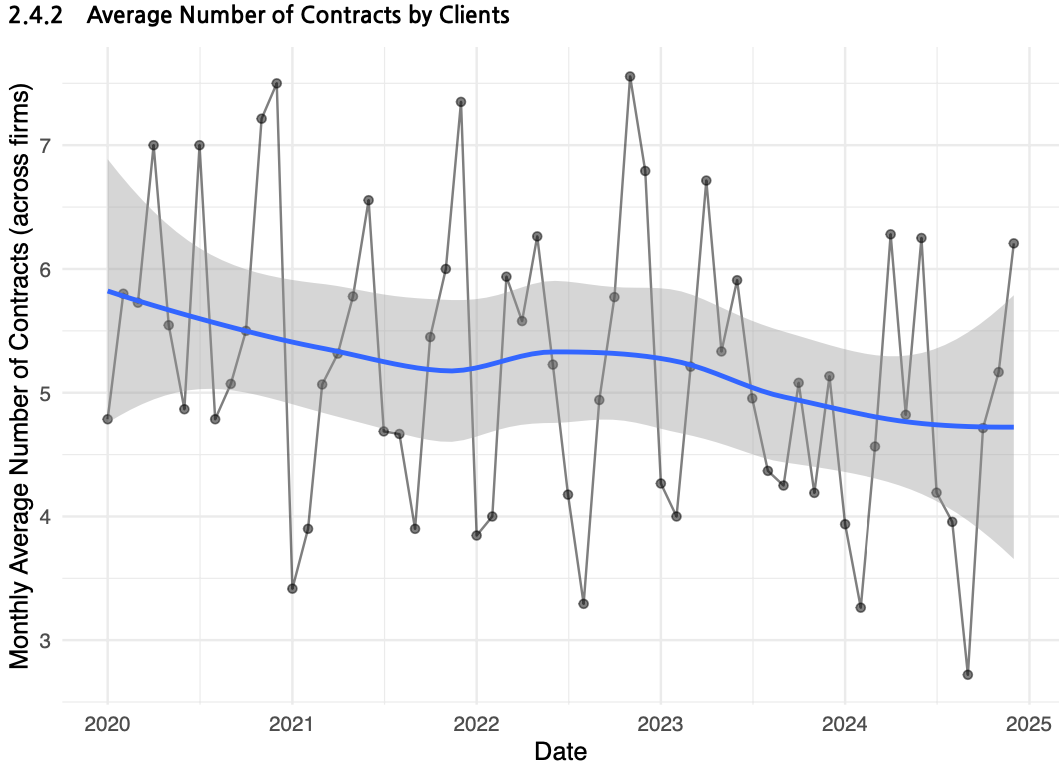
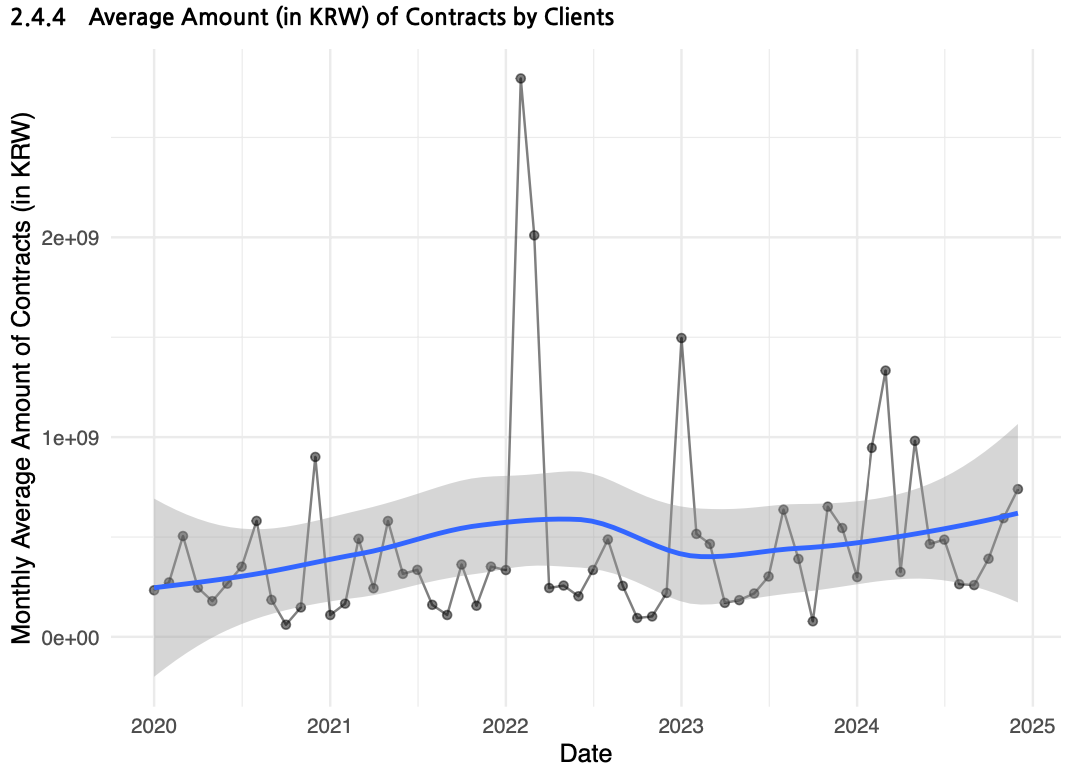
Average Number of Contracts and Average Contract Value for CLIWANT Client Companies
The win rate of CLIWANT client companies has also been gradually declining since 2020, currently averaging around 25–30%.
This trend may be driven by several factors—most notably, the growing participation of newer companies that have only recently entered the bidding space, which may have contributed to a lower overall win rate.
Regardless of the underlying causes, the data reflects an increasingly competitive bidding environment—one that is prompting more companies to adopt external solutions like CLIWANT to stay ahead.
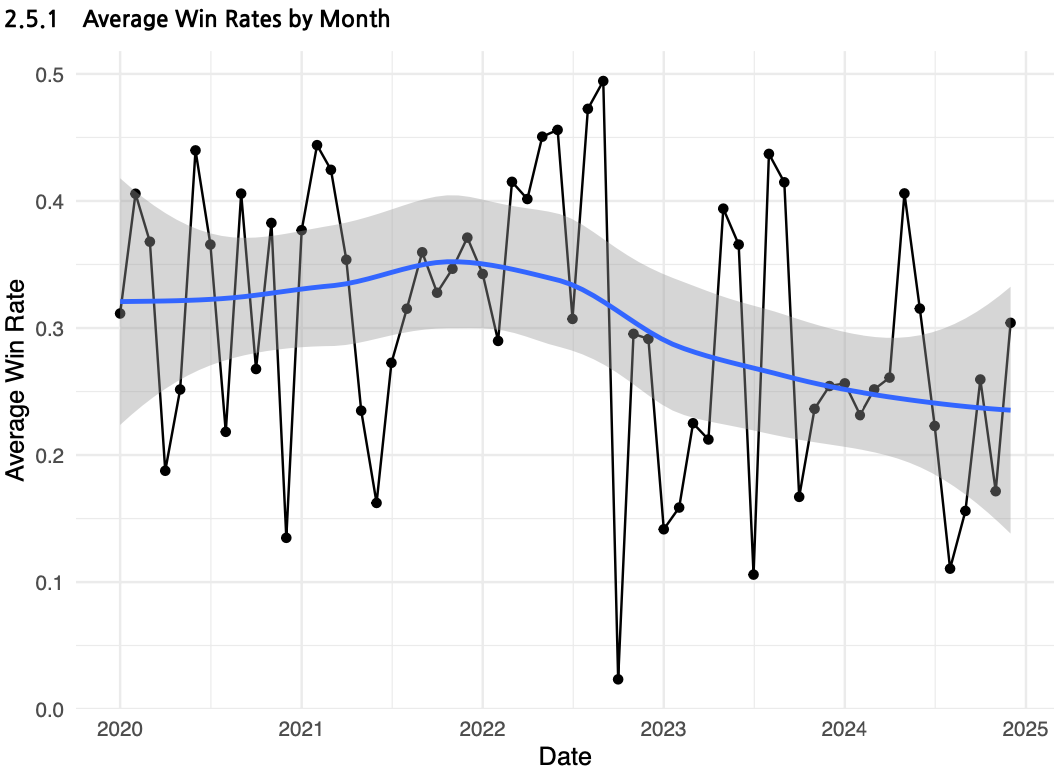
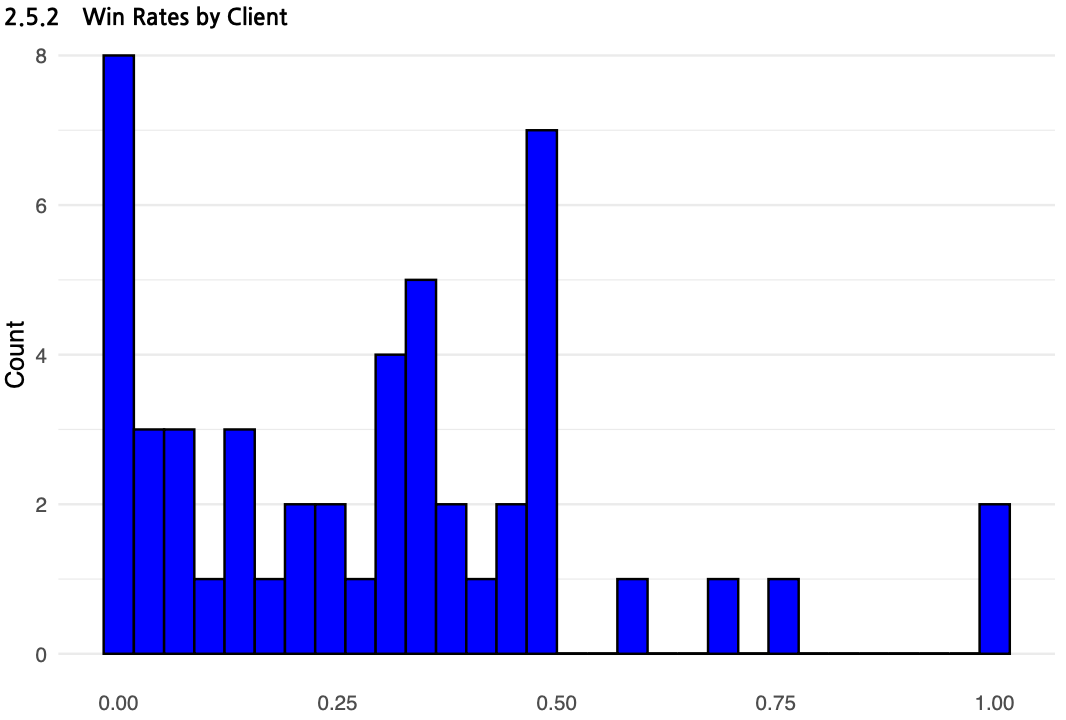
Average Win Rate and Distribution for CLIWANT Client Companies
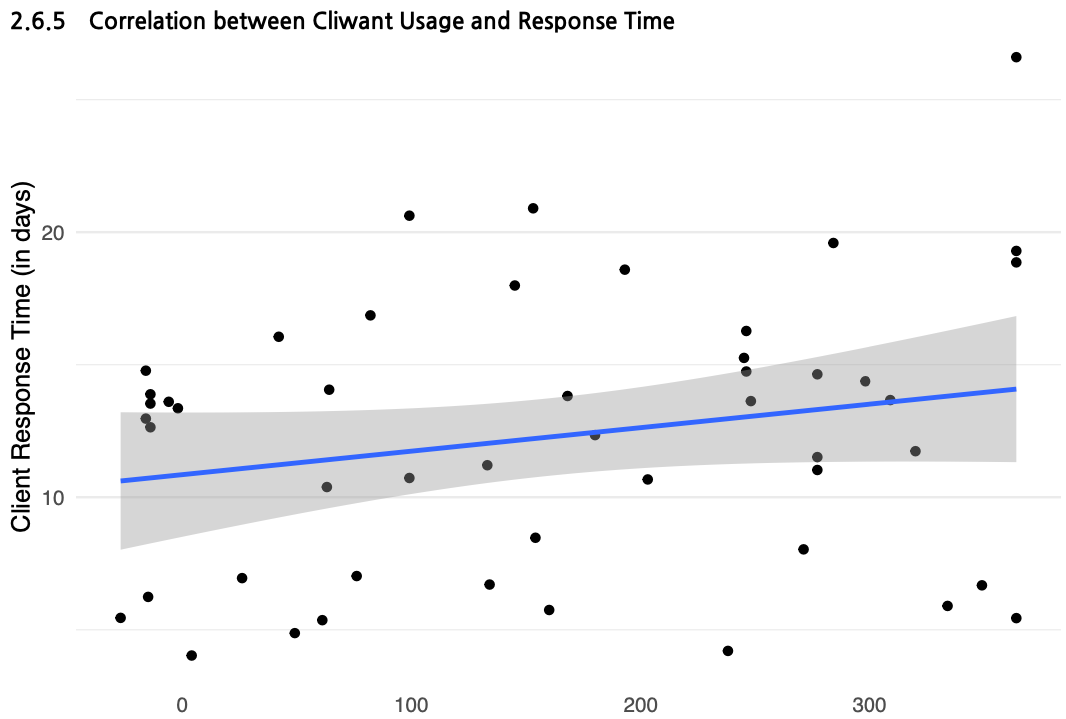
Over time, the period between bid announcement and participation has been steadily decreasing. Currently, the average response time has shortened to approximately 12.5 days.
However, it's difficult to determine the exact causes or intentions behind this trend. Multiple factors are at play—some companies may be submitting bids indiscriminately, while others may be carefully reviewing the RFP before deciding to participate.
Therefore, a shorter response time should not be interpreted as inherently positive or negative.
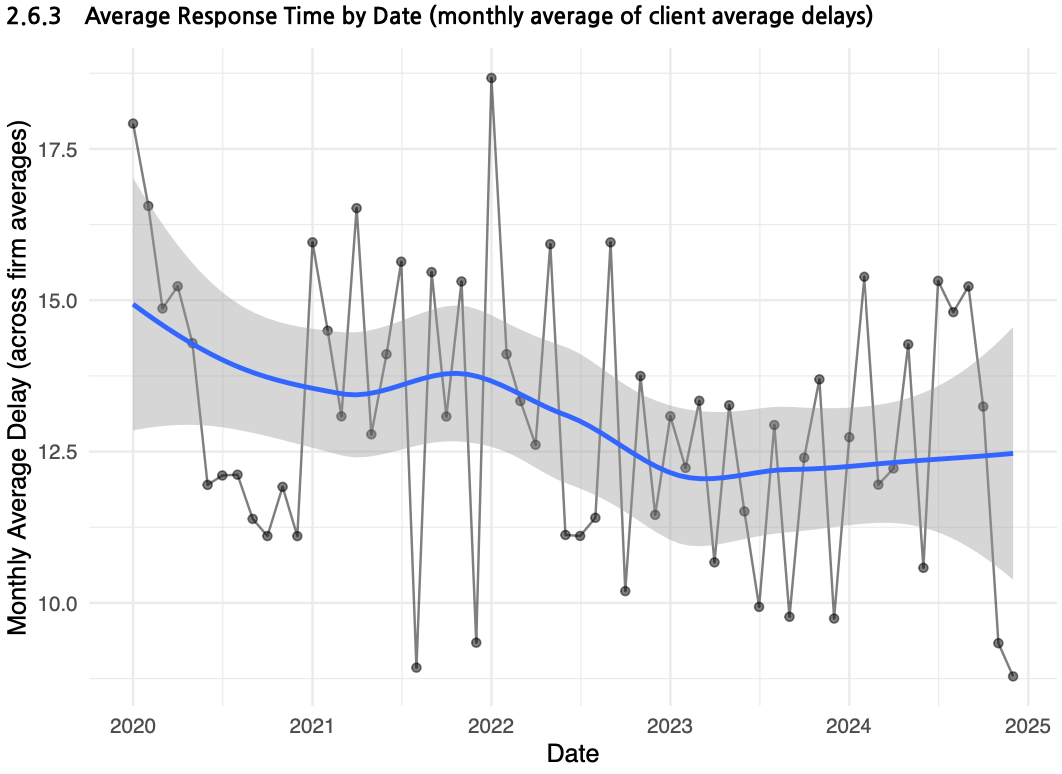
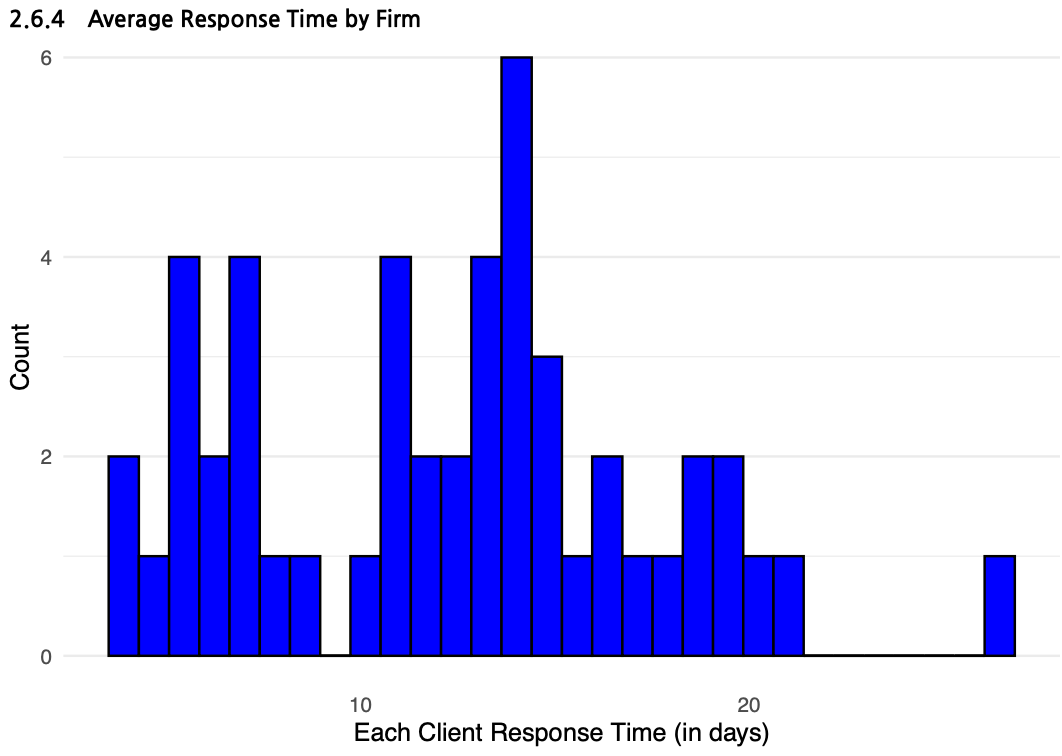
Average Response Time and Distribution from Bid Posting to Participation for CLIWANT Client Companies
Interestingly, after adopting CLIWANT, the average time taken to participate in bids has slightly increased. Initially, it was expected that CLIWANT would streamline the bidding process and reduce response time. Had the platform made no real impact, we would likely have observed only a slight decrease in response time aligned with general industry trends—or little to no change at all.
However, the increase in response time suggests a different insight. CLIWANT’s AI-powered bid recommendation feature helps companies identify more relevant and strategic opportunities. As a result, companies that previously submitted bids indiscriminately due to a lack of information are now approaching the process more deliberately, which likely extends the preparation time per bid.
This behavioral shift may also explain why the number of wins and contracts has decreased, while the total contract value has remained stable. In other words, companies are becoming more selective and strategic, focusing on opportunities that better align with their capabilities.
To better understand the reasoning behind this shift, we conducted the following client survey.
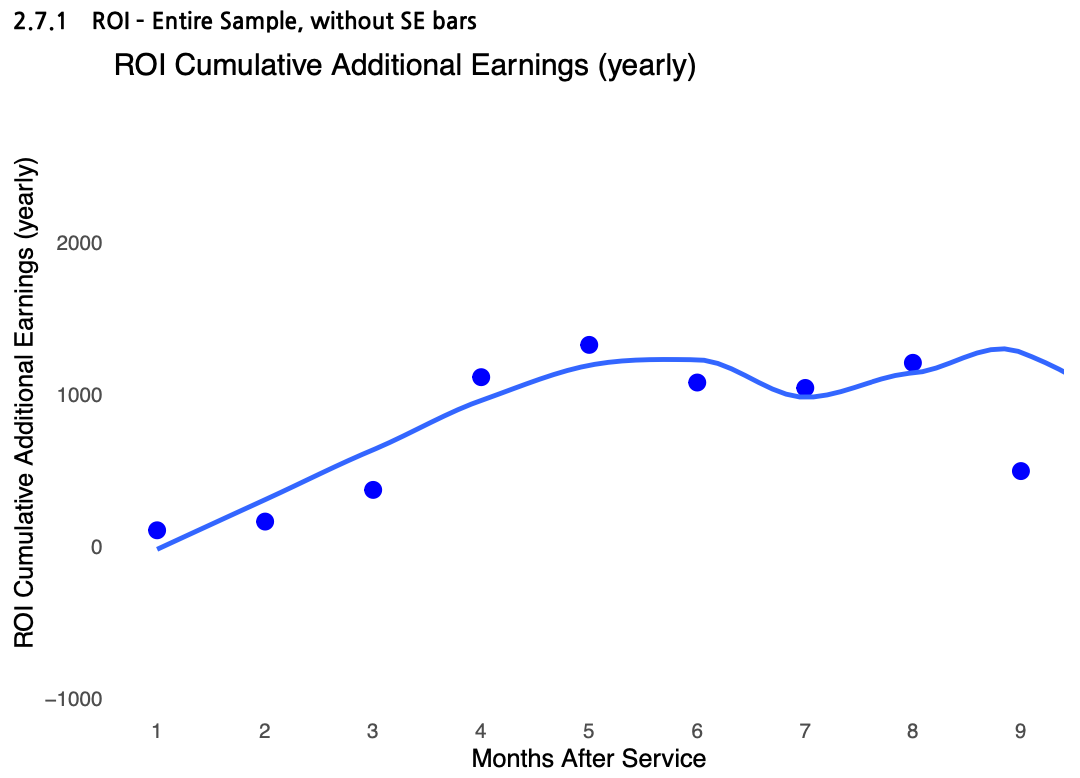
The return on investment (ROI) for CLIWANT’s service fees showed consistently positive results.
While CLIWANT is positioned at the higher end of the software market—with its most comprehensive global plan priced around $10,000—clients who strategically leveraged features like bid discovery, AI-powered RFP analysis, competitor insights, and government budget tracking were able to generate returns that far exceeded the cost of the service.
In fact, most client companies not only recovered their initial investment but also saw their ROI increase steadily over time, indicating that the longer CLIWANT is used, the greater its cumulative impact.
Of course, we considered the possibility that the data might be skewed by a small number of mid-sized or large companies dominating the bids. To validate this, we divided CLIWANT clients into two groups: the top 25% by contract value (“Big Firms”) and the remaining 75% (“Small Firms”), and analyzed each group separately.
As expected, Big Firms began securing contracts from the first month and recorded ROI that exceeded their subscription fees almost immediately. In contrast, Small Firms did not achieve returns equal to the service cost during the first four months. However, starting in month five, their ROI climbed significantly, showing a clear and accelerating growth pattern.
This suggests that Small Firms—often with less experience and fewer internal resources—may face initial challenges, but begin to see measurable results after a certain period of usage.
Based on these insights, CLIWANT is focused on shortening the time-to-ROI, making it easier for not only experienced bidders but also first-time participants to experience value quickly.
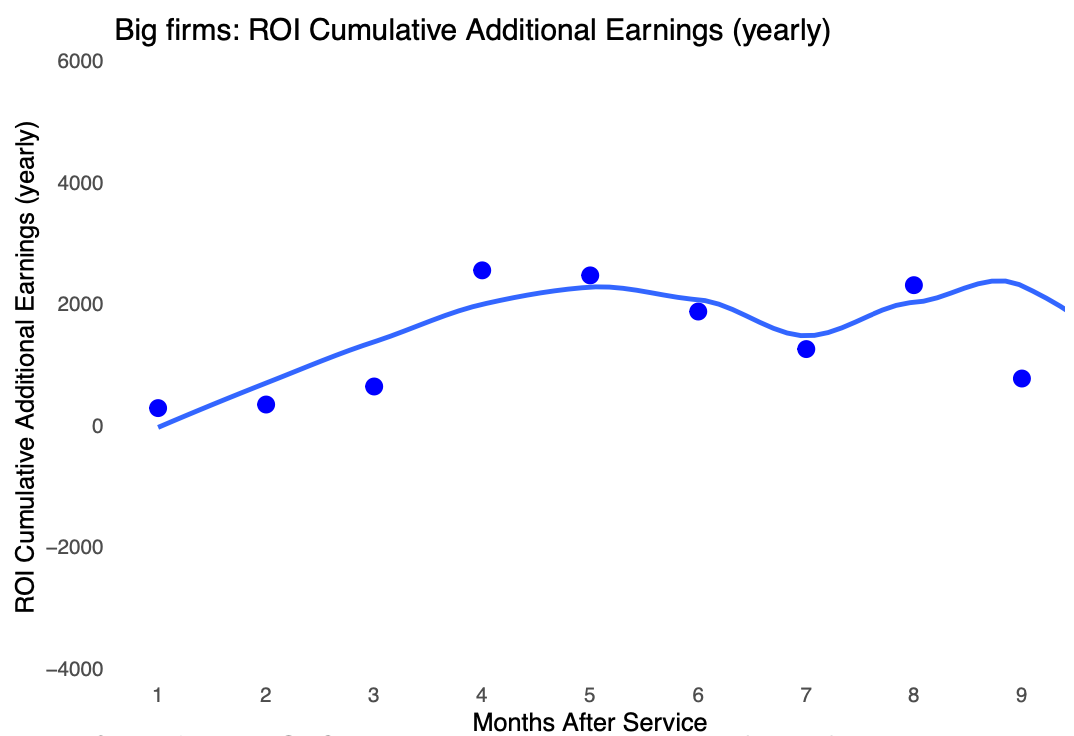
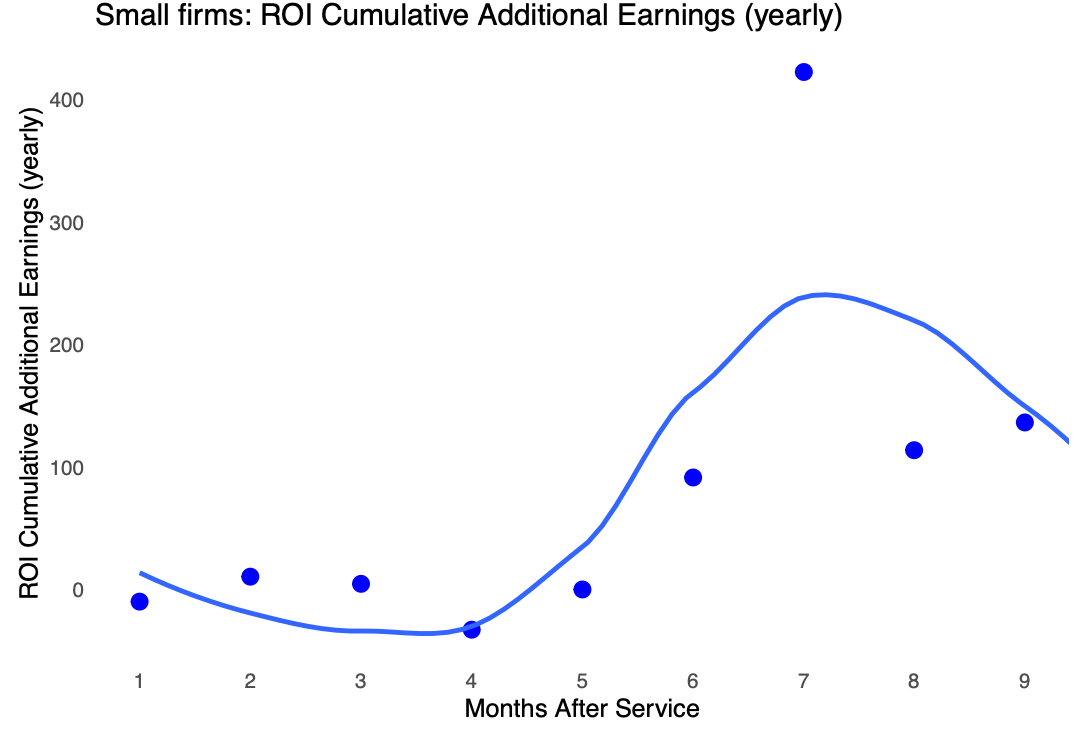
Monthly Return on Investment (ROI) Compared to CLIWANT Subscription Fee for Big Firms and Small Firms
2. CLIWANT Client Survey
So far, we’ve shared insights based on publicly available procurement data from the Public Procurement Service. To better understand how clients actually experience the service, we conducted a survey in December 2024, with 26 companies voluntarily participating (response rate: 44%).
We first examined usage frequency. The most common response came from clients who use CLIWANT for more than 10 minutes daily. Encouragingly, most clients reported continued and consistent use after adopting the platform.
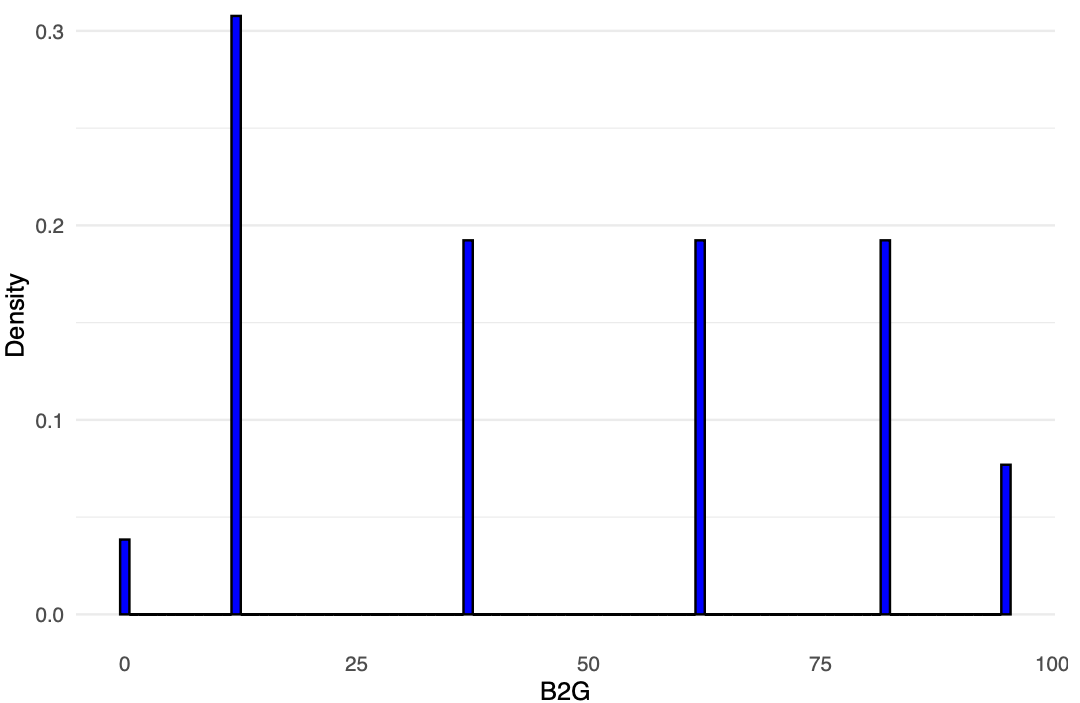
A survey of CLIWANT client companies revealed a wider-than-expected range in the proportion of total revenue coming from the public sector.
Importantly, the results indicate that CLIWANT is not used exclusively by B2G companies—many B2B and B2C companies are also actively pursuing public sector projects alongside their core business.
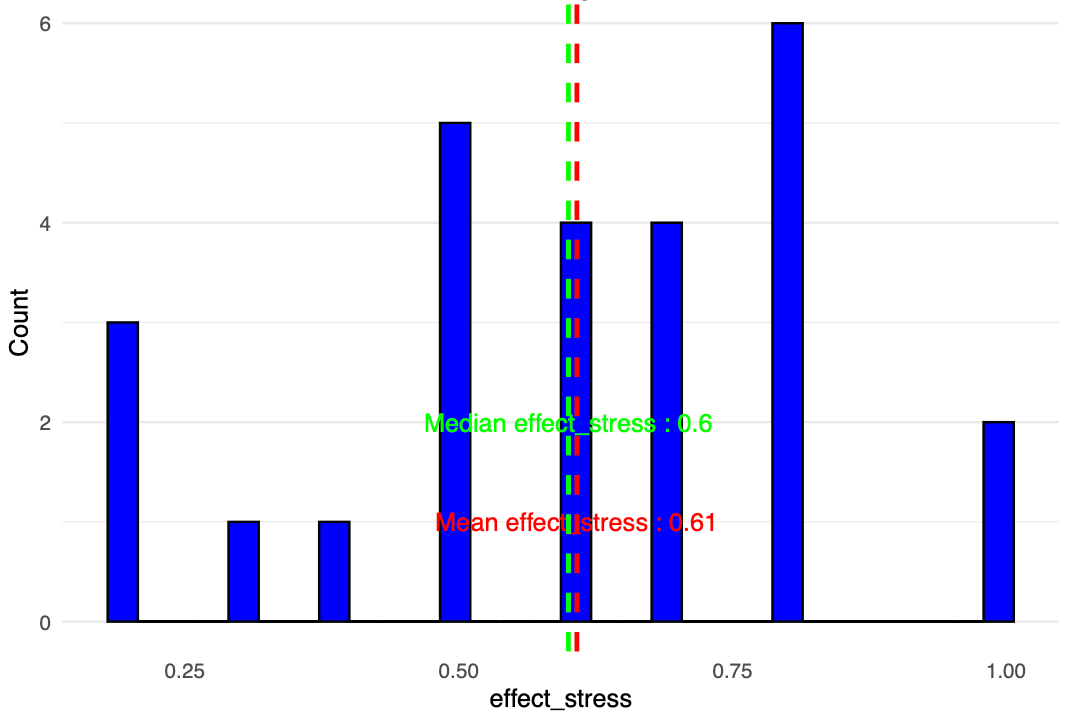
A survey on stress reduction related to procurement tasks after adopting CLIWANT showed an average decrease of 61%.
While stress reduction is inherently subjective, it remains a valuable indicator of user satisfaction, especially from the perspective of those directly involved in day-to-day procurement work.
CLIWANT will continue working to further enhance this level of satisfaction through product improvements and user support.
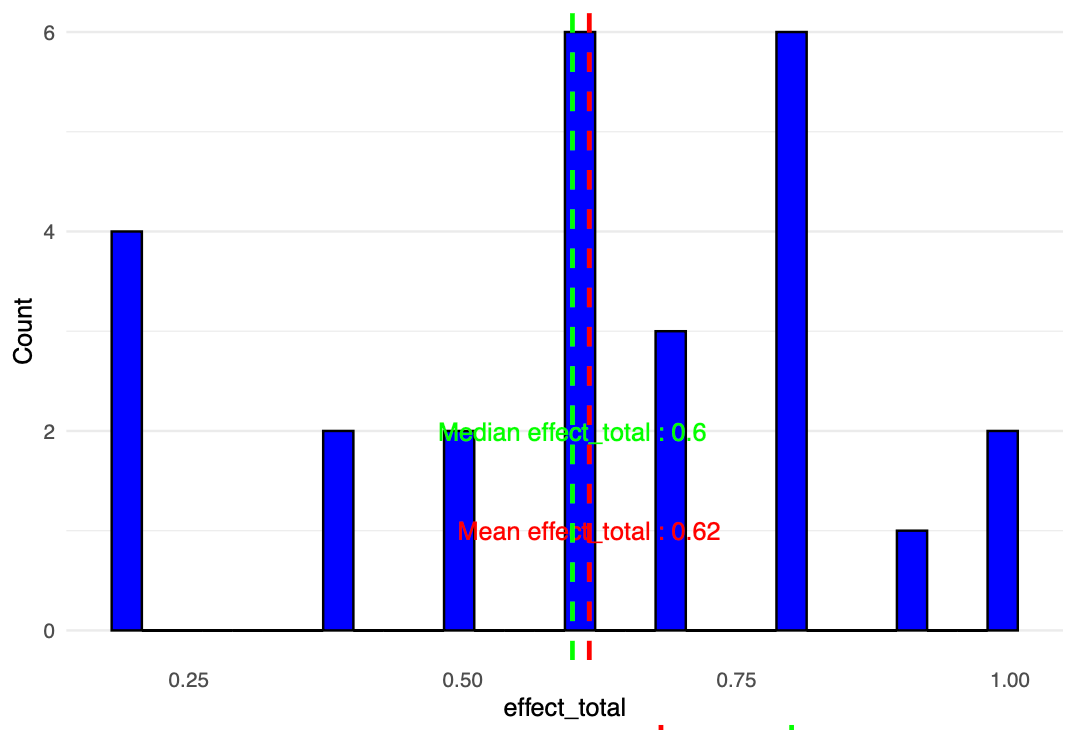
A survey on how effectively CLIWANT reduces time spent on procurement tasks showed an average time reduction of 62%.
Based on a simple calculation, for an in-house bidding manager earning $50,000 annually, this translates to a potential yearly cost saving of approximately $31,000 per person.
Given that most companies typically have 5 to 7 team members using CLIWANT, the overall cost-saving impact can be significantly higher.
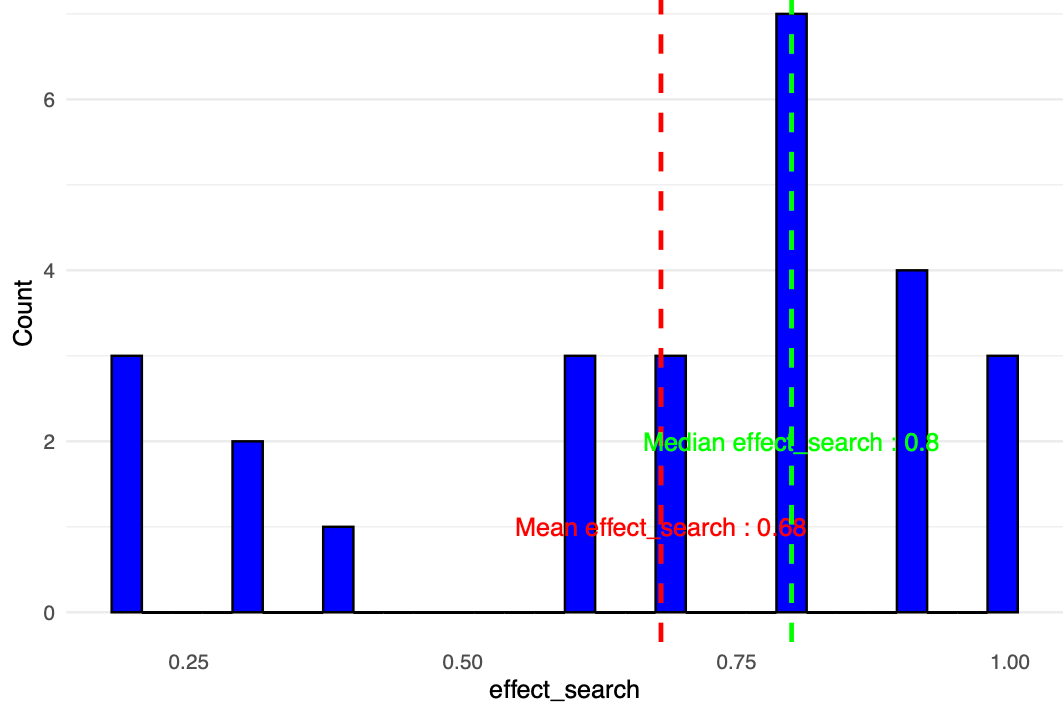
Next, we analyzed the time-saving impact of CLIWANT’s three core features in more detail:
- Bid Search: 68% average time reduction
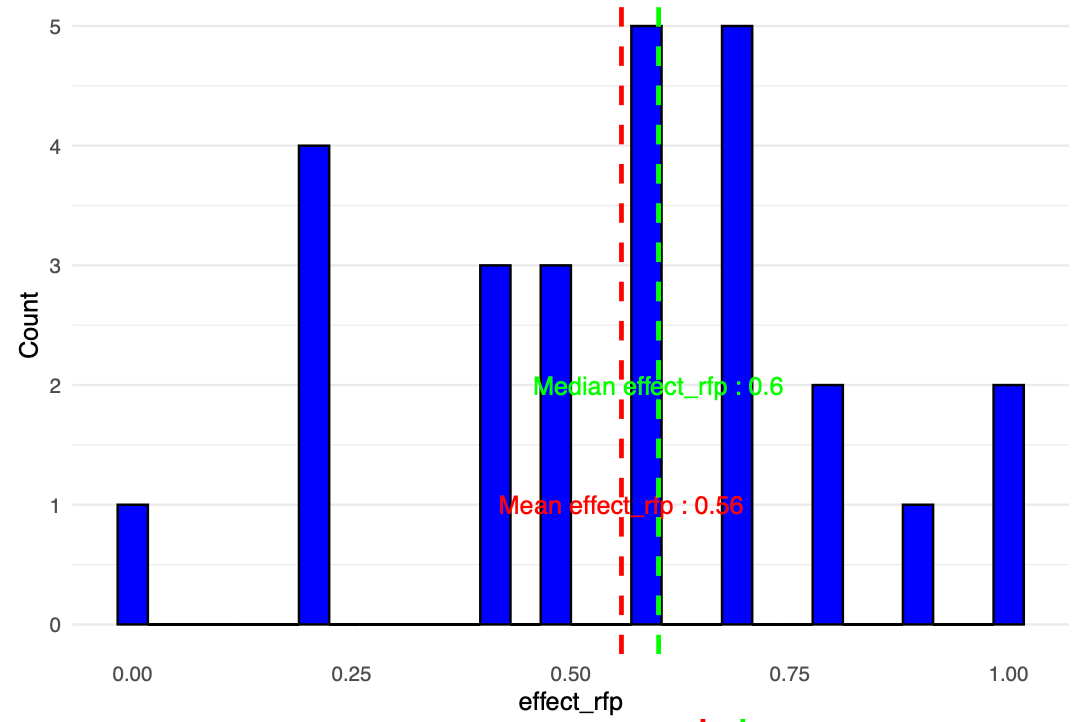
- RFP Review: 56% average time reduction
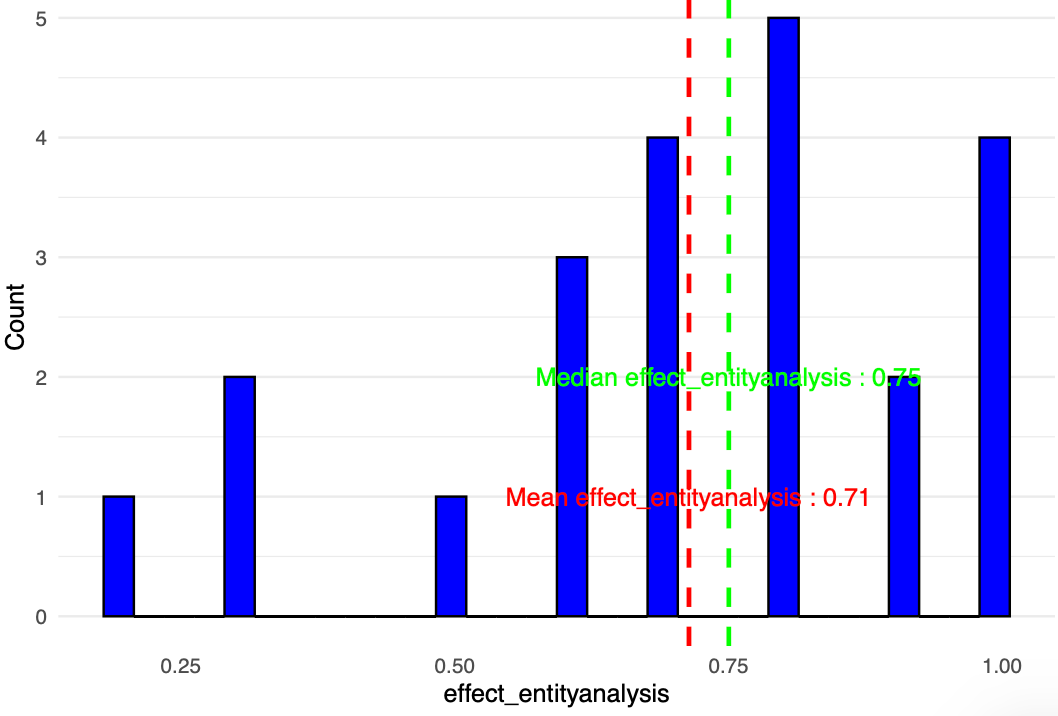
- Competitor & Buyer Analysis: 71% average time reduction
While the results slightly differed from our initial expectations, a closer look revealed that they were quite reasonable and aligned with real-world experiences.
For bid search and RFP review, although CLIWANT’s features—such as curated bid recommendations, RFP summaries, and intelligent matching—are highly convenient, experienced bid managers may already handle these tasks effectively using their existing knowledge. The real challenge arises when new team members join, and transferring that expertise becomes a difficult task.
In contrast, competitor and buyer analysis is a data-driven process, where traditional know-how reaches its limits. Understanding key aspects like which companies have won which projects, who their competitors were, their win rates, and which vendors are collaborating with major agencies is crucial for crafting a competitive bidding strategy.
But strategy isn’t about being flashy; it’s about understanding who your potential customers are, what they need, and how your capabilities compare to those of your competitors. Without this foundation, companies often rely on hearsay, personal connections, or even flawed assumptions—leading to poor decisions that can seriously affect their revenue.
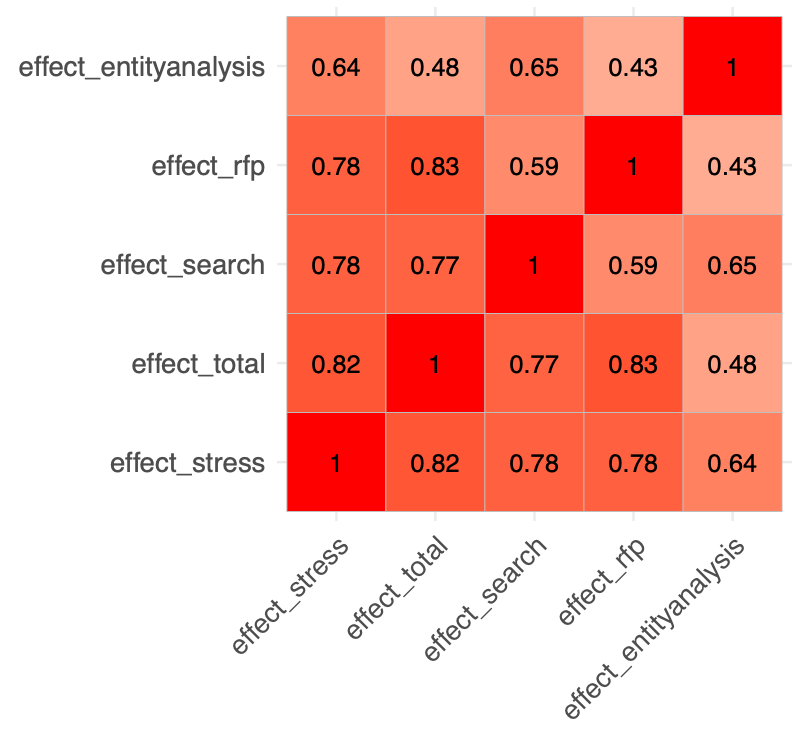
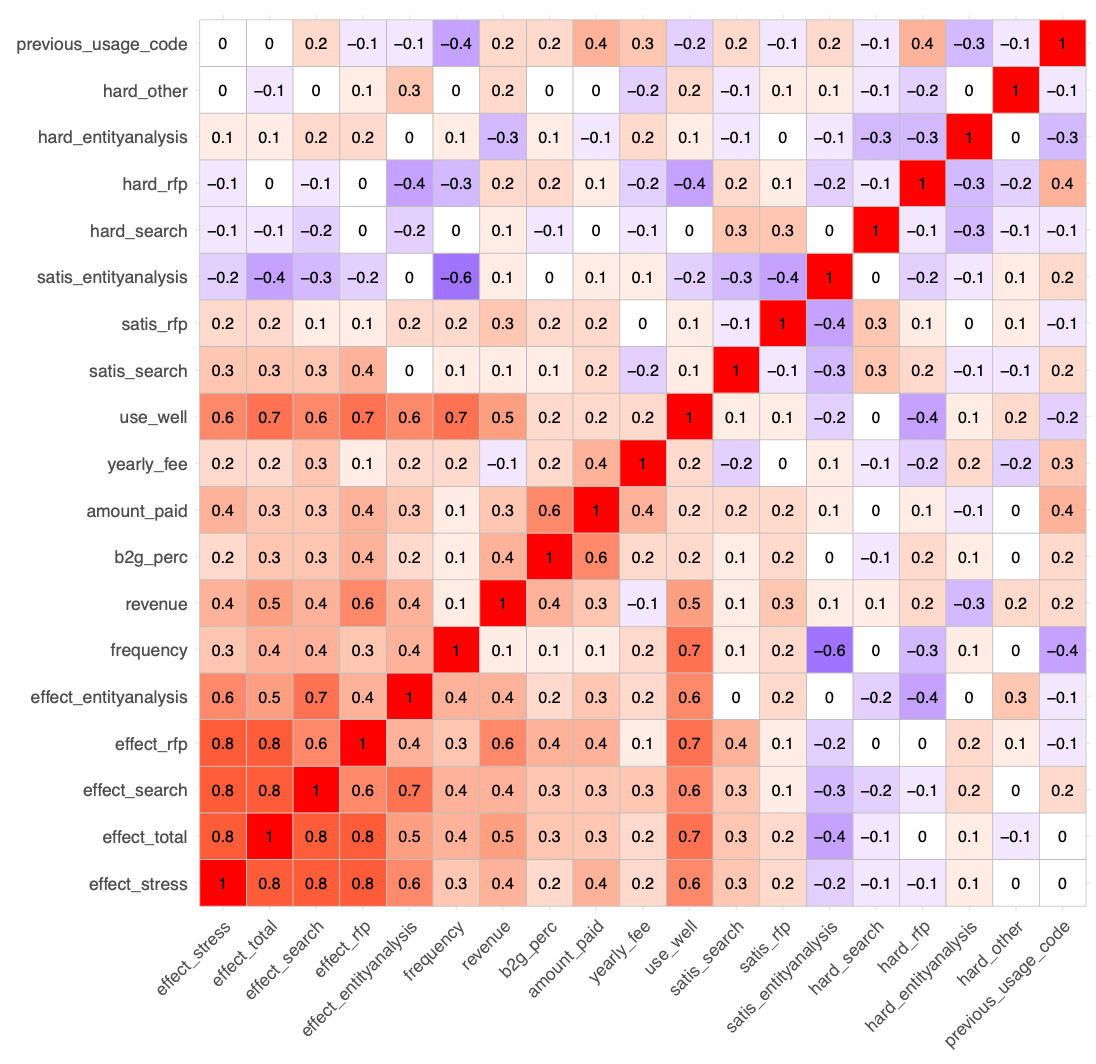
Lastly, we analyzed the correlations between multiple survey items and visualized the results in a heatmap. The findings revealed several unexpectedly interesting insights.
For reference, each number in the heatmap represents a correlation coefficient between two variables:
- A value close to 1 indicates a strong positive correlation
- A value near 0 suggests little to no correlation
- A value close to -1 indicates a strong negative correlation
Fortunately, all the correlations were intuitively understandable, which suggests that respondents answered the survey sincerely.
Here are the three strongest correlations we observed:
- The more time is saved on procurement tasks, the more stress levels decrease.
- Correlation between overall time reduction (
effect_total) and stress reduction (effect_stress): 0.82
- RFP review plays a critical role in overall procurement efficiency.
- Correlation between overall time reduction (
effect_total) and RFP review efficiency (effect_rfp): 0.83
- Bid search is closely linked to stress levels.
- Correlation between time reduction in bid search (
effect_search) and stress reduction (effect_stress): 0.78
In contrast, the correlation coefficients related to competitor and buyer analysis (effect_entityanalysis) were relatively low:
- Correlation with overall time reduction (
effect_total): 0.48 - Correlation with stress reduction (
effect_stress): 0.60
These results appear somewhat inconsistent with earlier findings where competitor and buyer analysis showed an average 71% time reduction. Despite the substantial time savings, its connection to overall procurement efficiency or stress reduction seems relatively weaker.
From the respondents’ perspective, this may suggest that bid search and RFP analysis are seen as core components of procurement work, while competitor and buyer analysis tends to be viewed as more of a supplemental task—similar to market research or business development.
These perceptions likely reflect practical realities in the field, helping to explain the lower correlations. As a result, CLIWANT now recognizes the need to emphasize the strategic value of market and competitor intelligence—through seminars, training programs, and education going forward.
Below is the full correlation heatmap, which includes not only the key survey items discussed earlier, but also foundational variables such as CLIWANT usage frequency, user familiarity, and B2G revenue share.
While no entirely new insights emerged from this expanded view, the results reaffirm a clear pattern: the more familiar clients are with CLIWANT, the more they perceive time-saving benefits in their procurement workflows.
- Correlation between overall time reduction (
effect_total) and user familiarity with CLIWANT (use_well): 0.70
Of course, not all clients are fully proficient in using CLIWANT’s features yet. To support this, we regularly produce tutorial and guide content.
That said, our long-term focus remains on improving the product’s UI/UX through design research and user interviews. By making the platform easier and more intuitive to use, we aim to deliver real, measurable time savings across procurement tasks.
3. Performance Comparison: CLIWANT Clients vs. Non-Clients
Finally, the highlight of this study is the performance comparison between CLIWANT clients and non-clients. This analysis is the foundation for CLIWANT’s upcoming academic collaboration with Northwestern University in the U.S., where the goal is to explore the broader impact of AI on public procurement through joint research.
In the second half of this year, we plan to conduct a more precise comparative experiment involving 1,000 randomly selected U.S.-based companies. Companies that receive CLIWANT's AI services will be matched 1:1 with those that do not, allowing us to objectively measure performance differences.
We are able to openly share this research initiative because, globally, very few companies—if any—have advanced AI-powered bid solutions to a level where they can be studied academically. The findings are expected to be published in a U.S. academic journal and contribute meaningfully to the academic understanding of AI’s role in procurement.
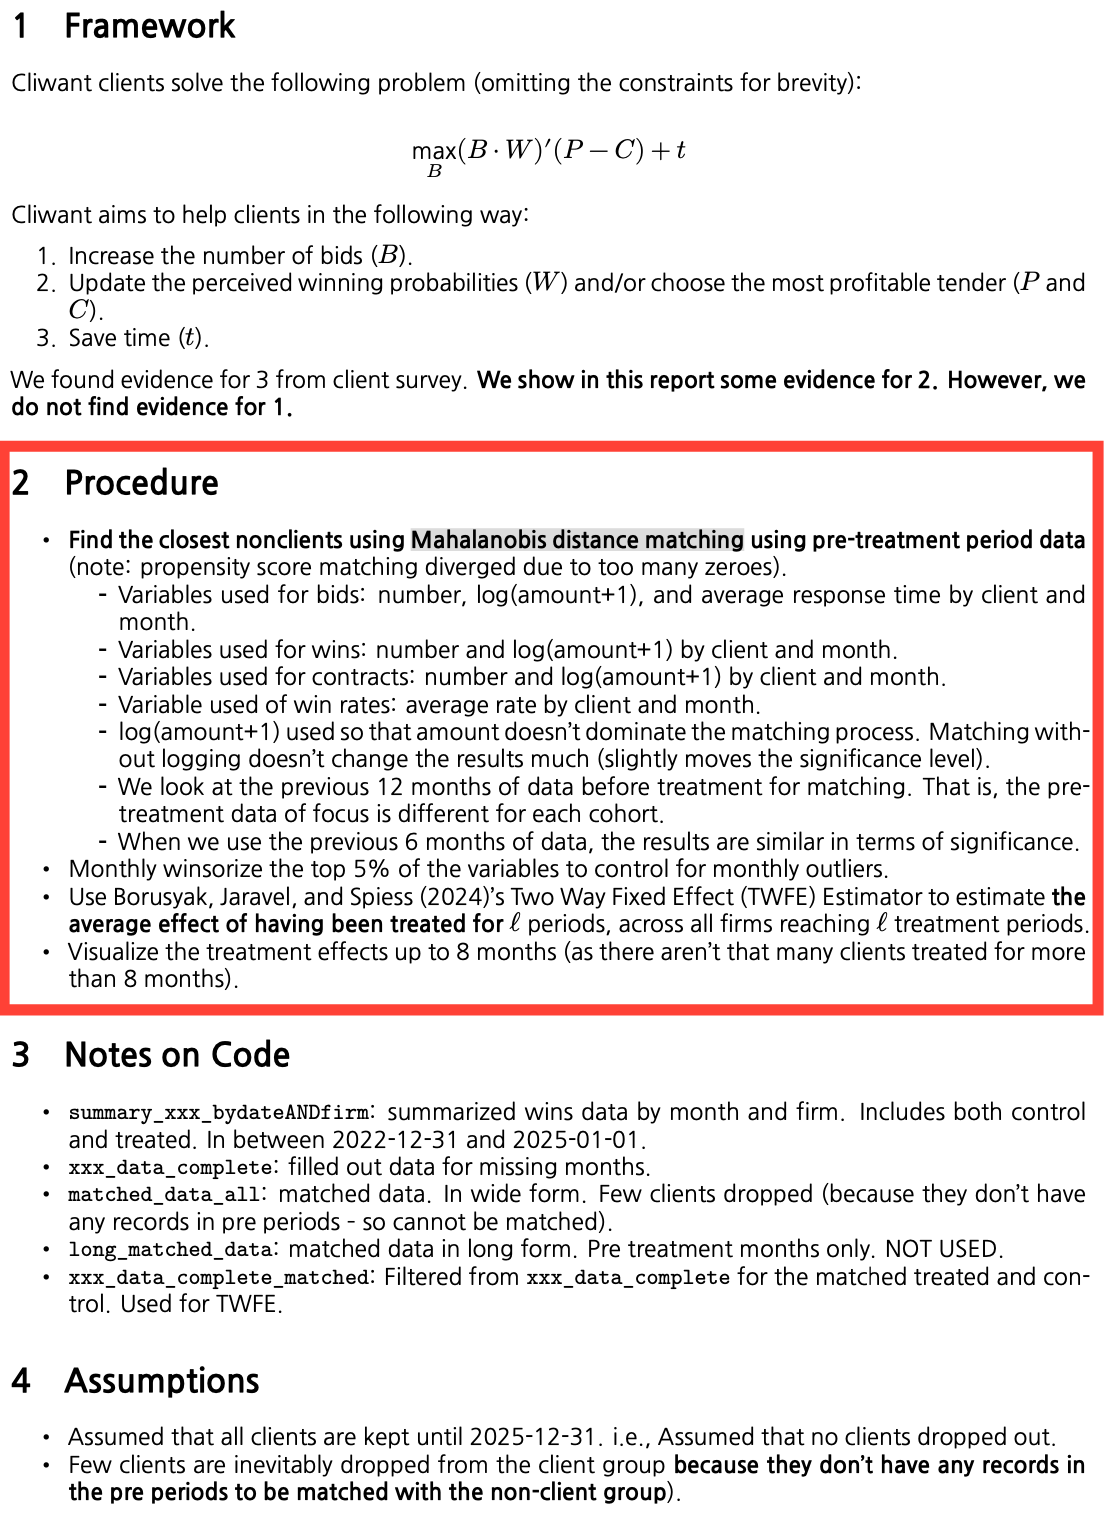
That said, since the experimental study has not yet been conducted, the best available method for an indirect comparison at this stage is to create a non-client group from among the 500,000+ companies registered in Korea’s public procurement system that exhibit similar bidding patterns to CLIWANT clients.
To do this, we applied Mahalanobis Distance Matching (MDM)—a technique widely used in medical and economic research to match similar observation units between treatment and control groups when only observational (non-experimental) data is available.
Simply put, it works like comparing two groups—those who received the treatment (in this case, CLIWANT service) and those who didn’t—by matching individuals with similar characteristics for a fair comparison.
Of course, this approach has its limitations. Many factors can influence outcomes beyond the predefined variables. For instance, while we used metrics such as bidding frequency and the number of wins/contracts to define the non-client group, intangible elements like a company's “enthusiasm for bidding” are difficult to quantify and thus were not included in the data—even though such factors may have a significant impact on performance.
To overcome these limitations, randomized controlled experiments are necessary. By randomly assigning participants, we can control for external variables and derive more pure causal insights.
That said, let’s pause the discussion on experimental design and turn to the observational data comparison between CLIWANT clients and non-clients.
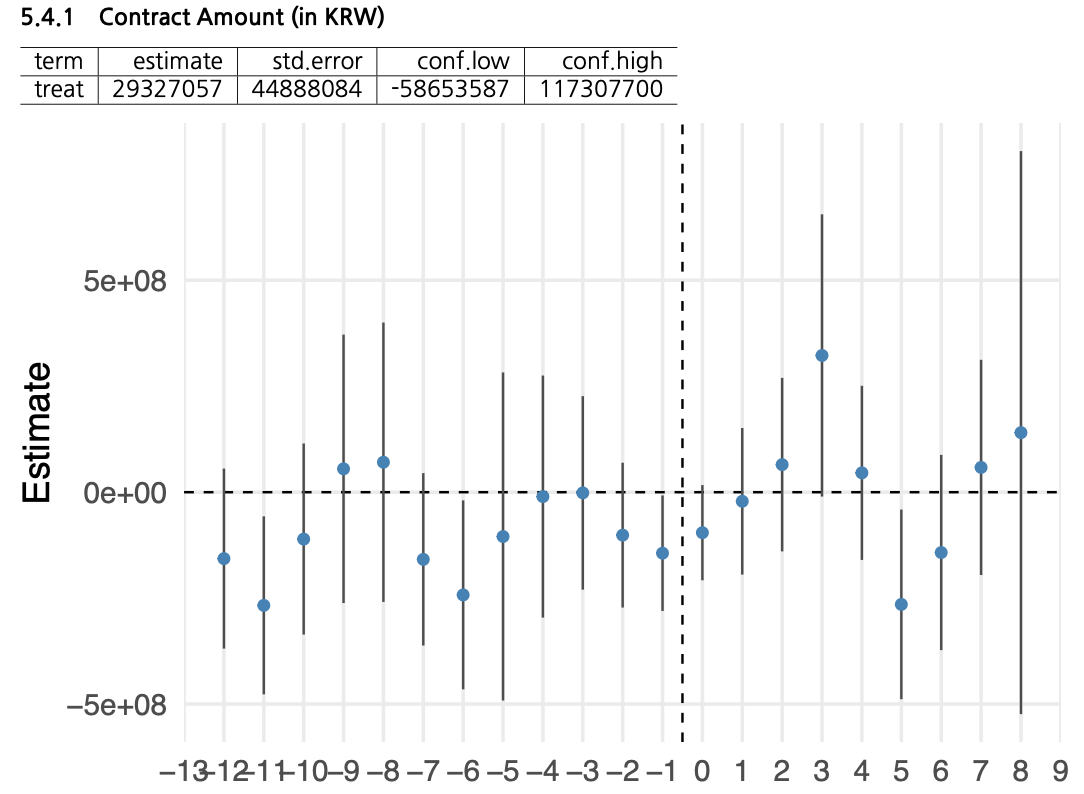
In the graph below, the left side of the dotted line represents the months before CLIWANT adoption, and the right side shows the months after. The blue dots indicate the difference between CLIWANT clients and the matched non-client group. A positive shift above zero implies a potential effect of CLIWANT. The shaded area around the line represents the confidence interval.
To start with, we observed no significant difference between clients and non-clients in terms of bid amount, number of bids submitted, or bid response time. This aligns with earlier findings where internal client data also showed minimal change in these areas before and after adoption.
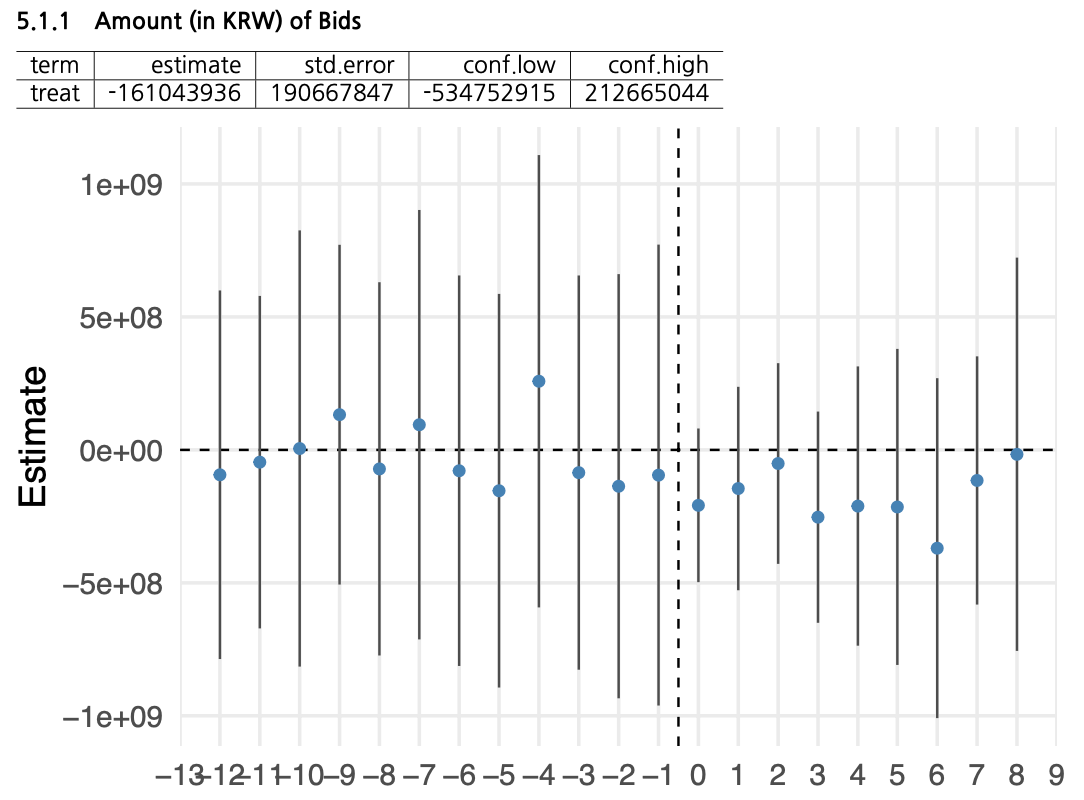
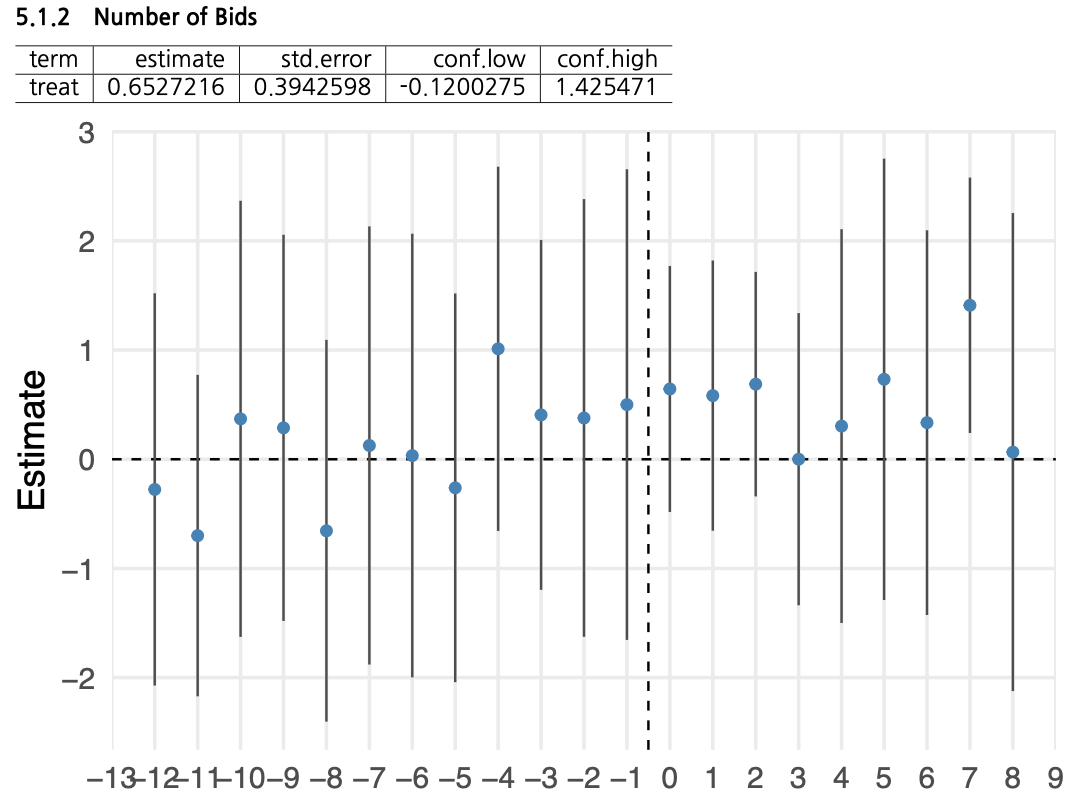
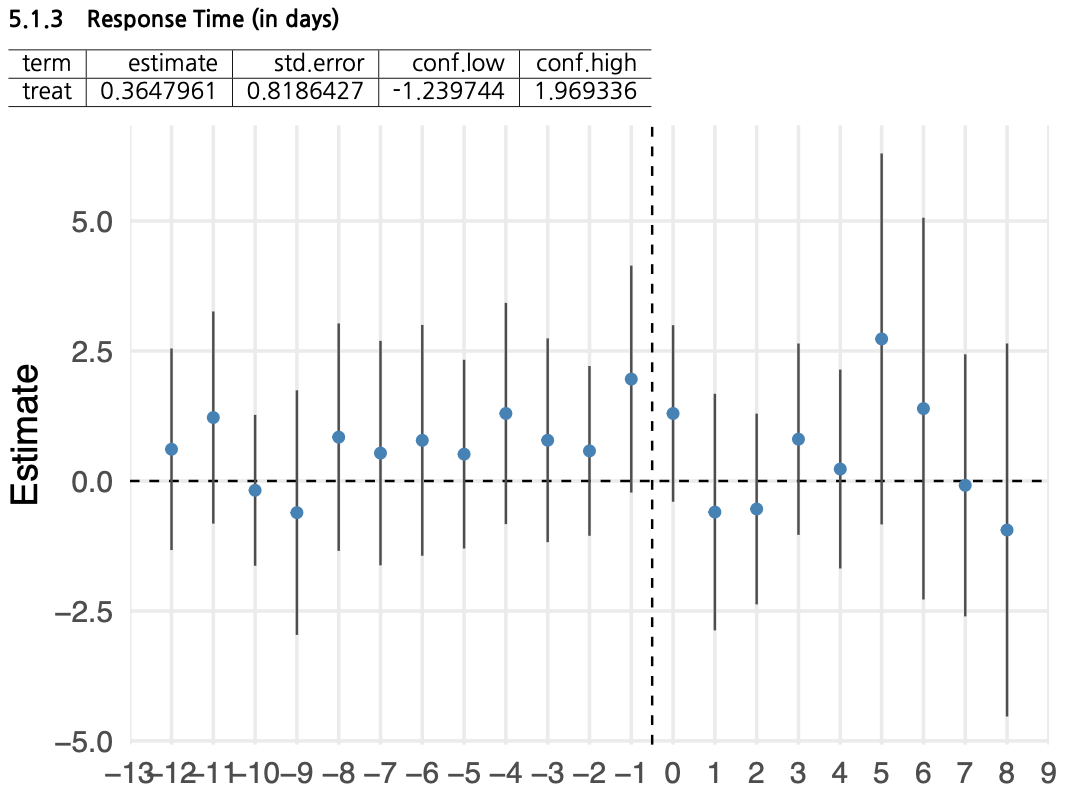
Bid Amount, Number of Bids, and Response Time
However, as shown in the graph below, the number of wins is statistically significantly higher for CLIWANT clients compared to non-clients, with a noticeable spike in the first month after adoption.
In addition, the total award amount was also significantly higher for CLIWANT clients. In fact, during the first month, the difference reached approximately $150,000. That said, it is worth noting that this performance gap tends to narrow over time, which is a somewhat disappointing trend.
These findings suggest that CLIWANT doesn’t merely increase the number of bids submitted, but rather plays a key role in helping companies identify higher-quality opportunities and make more strategic bidding decisions.
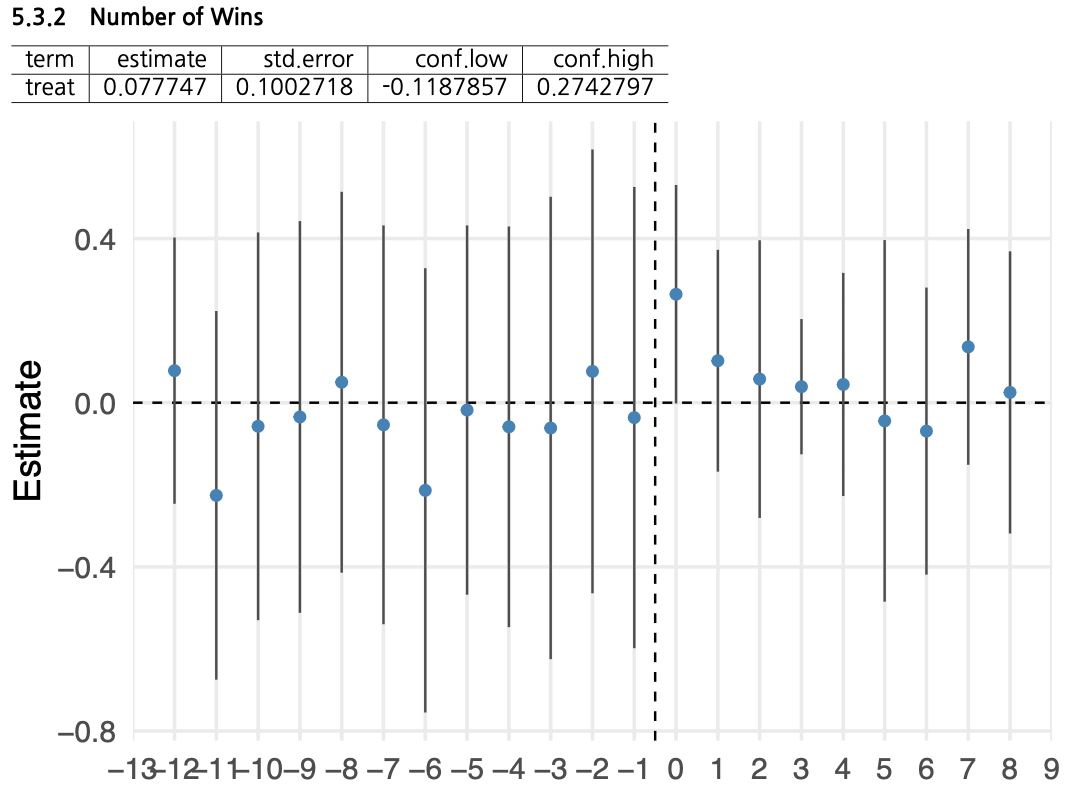
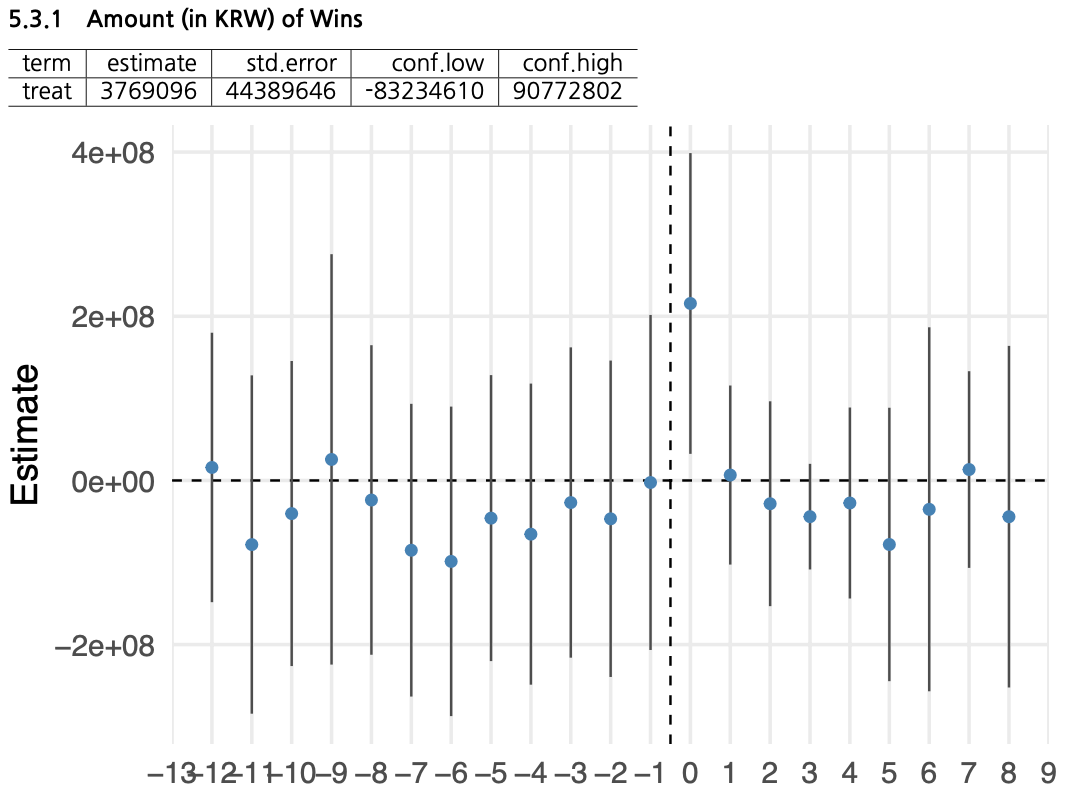
Number of Wins, Award Amount
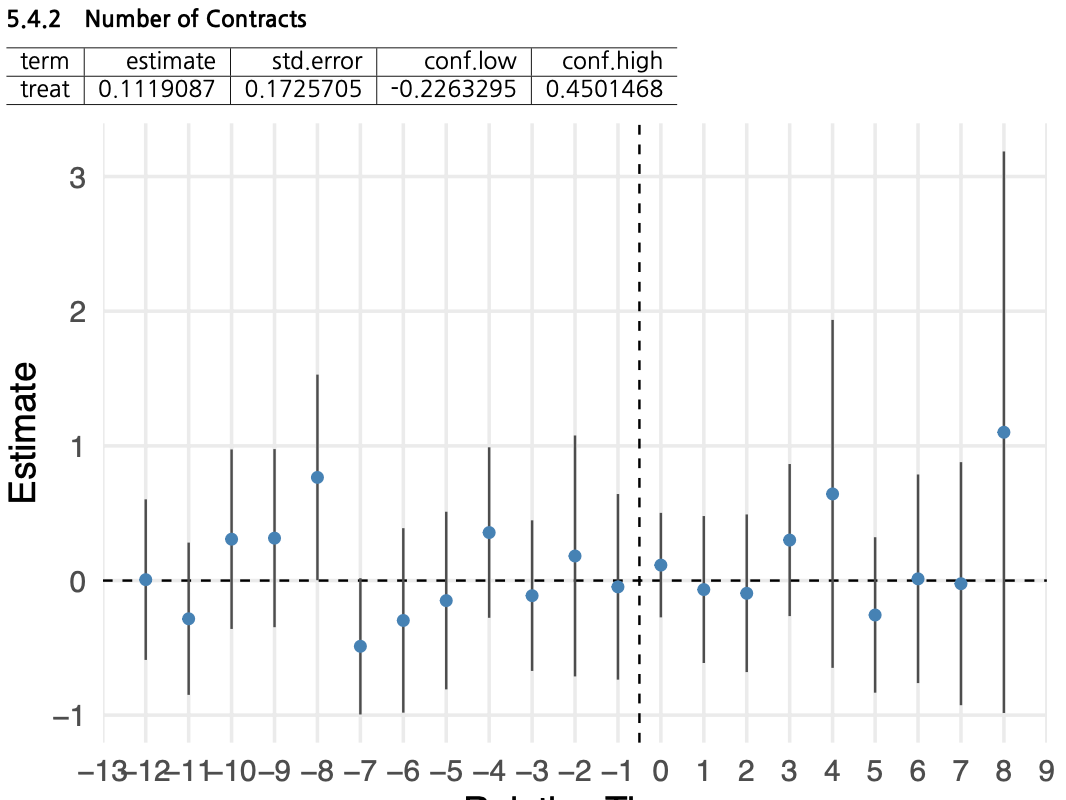
In the contract data, there was no significant difference between CLIWANT clients and non-clients in terms of the number of contracts awarded. However, in terms of contract value, CLIWANT clients outperformed non-clients.
Interestingly, unlike the bidding results, the difference in contract value became more pronounced around three months after adoption.
That said, it’s worth noting that this performance gap was not sustained over time, which remains a point of concern.
Reflecting on CLIWANT’s First Year
Although the release of this analysis came a bit later than planned, the data covers the period from January 1 to December 31, 2024. After thoroughly reviewing the numbers, we believe that—even in our first year—CLIWANT was able to deliver meaningful outcomes for our clients.
That said, this has reinforced our commitment to delivering even more compelling results in the future—so impactful that users can feel the value of CLIWANT without needing any report, and word of mouth alone is enough to build trust.
This study has been a valuable opportunity for self-reflection, and we would like to extend our sincere thanks to Dr. Nicolas Min of Northwestern University, who led the in-depth analysis.
The full dataset and original materials are shared transparently below.
(Appendix) Methodological Note on Client vs. Non-Client Comparison
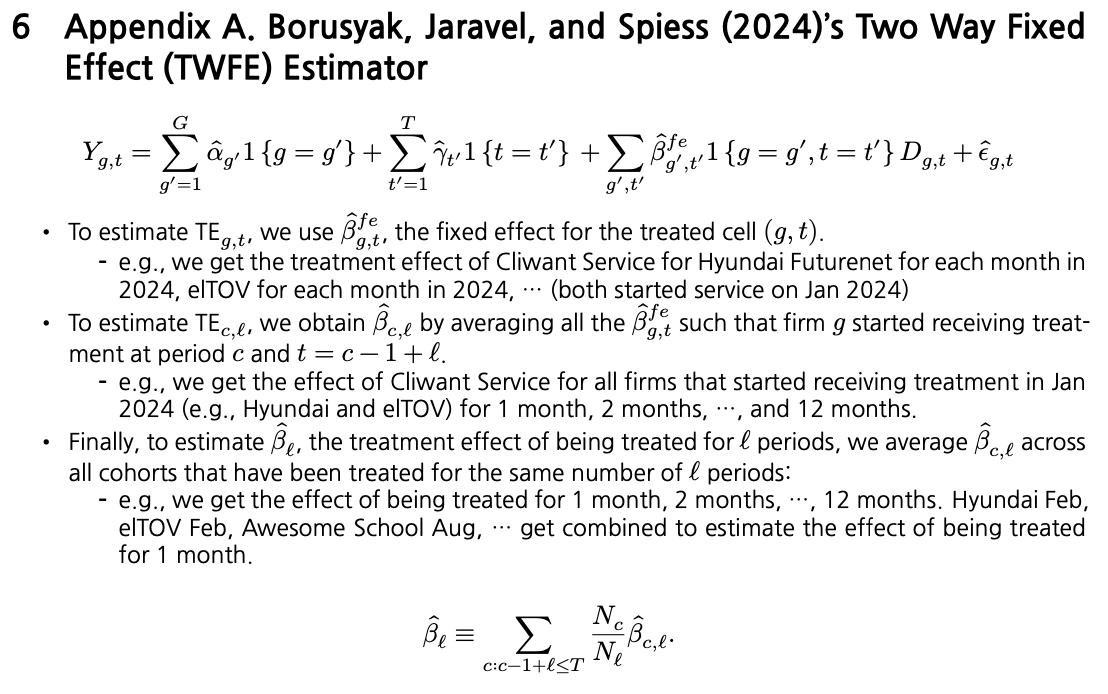
For this analysis, we employed the Two-Way Fixed Effects (TWFE) model proposed by Borusyak, Jaravel, and Spiess (2024) to evaluate the impact of CLIWANT adoption on company bidding performance.
By applying the TWFE model, we were able to control for both firm-specific and time-specific fixed effects, allowing us to isolate the pure effect of CLIWANT adoption, independent of each company’s inherent characteristics or external market fluctuations.
Furthermore, this study was grounded in a causal inference framework, aiming to estimate the causal impact of CLIWANT adoption rather than simple correlations.
This approach enabled us to rigorously assess whether CLIWANT has a statistically significant and sustained effect on bidding outcomes, and to do so in a manner that enhances the credibility and reliability of our findings.